

428
KEV
( . .. ) = Sum 0' catlons
meq / l
or anions In meq / l
(wlthout 51°2)
meq / l
Chapter 9 Denudation and Mass Transport
4
K
, ' ....
(1.30)
~r( 1
7
10.85)
16.4)
...---~ 5
3
CI
3
2
4 .
1 ; . ; . ; . : . : . : . : . . . . . . . . ä
3
:: 36:::
8
.:. :. :.:
1
87
o
o
Total dlssolved
sollds ( wlthout
mlnor constltuents)
98
MICA SCHIST
SHALES AND
SLATES
(devold 01
carbonate)
1
3
....
I
1
I
1/ '1. . . . . __
298.5 mg I
mmo
....
- - -
Si02
11.56)
;~lom'4 i
2
.... . . . .
18 71
1
7
3
(1 .0)
4
5
100
6
6
==.-3
5
151
10.45)
1~~
5~
l?l5
38
509
GRANITE,
GNEISS
ANDESITE,
QUARTZ-DIORITE
BASALT
QUARTZITIC
SANDSTONE
LIMESTONE
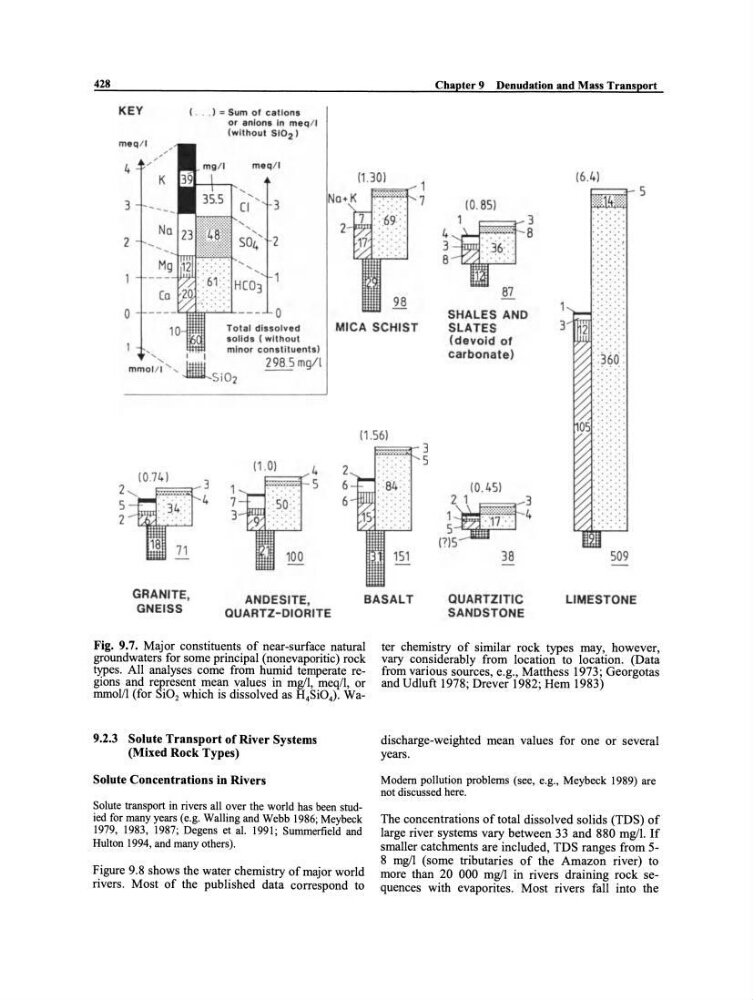
Fig. 9.7. Major constituents of near-surface natural
groundwaters for some principal (nonevaporitic) rock
types. All analyses come from humid temperate regions and represent mean values in mg/I, meq/l, or
mmol/l (for Si0 2 which is dissolved as H 4 Si0 4 ). Wa9.2.3 Solute Transport of River Systems
(Mixed Rock Types)
Solute Concentrations in Rivers
Solute transport in rivers all over the world has been studied for many years (e.g. Walling and Webb 1986; Meybeck
1979, 1983, 1987; Degens et al. 1991; Sumrnerfield and
Hulton 1994, and many others).
Figure 9.8 shows the water chemistry ofmajor world
rivers. Most of the published data correspond to
ter chemistry of similar rock types may, however,
vary considerably from location to Iocation. (Data
from various sources, e.g., Matthess 1973; Georgotas
and Udluft 1978; Drever 1982; Hem 1983)
discharge-weighted mean values for one or several
years.
Modem pollution problems (see, e.g., Meybeck 1989) are
not discussed here.
The concentrations of total dissolved solids (TDS) of
large river systems vary between 33 and 880 mg/I. If
smaller catchments are included, TDS ranges from 58 mg/I (some tributaries of the Amazon river) to
more than 20 000 mg/I in rivers draining rock sequences with evaporites. Most rivers fall into the
KEV
( . .. ) = Sum 0' catlons
meq / l
or anions In meq / l
(wlthout 51°2)
meq / l
Chapter 9 Denudation and Mass Transport
4
K
, ' ....
(1.30)
~r( 1
7
10.85)
16.4)
...---~ 5
3
CI
3
2
4 .
1 ; . ; . ; . : . : . : . : . . . . . . . . ä
3
:: 36:::
8
.:. :. :.:
1
87
o
o
Total dlssolved
sollds ( wlthout
mlnor constltuents)
98
MICA SCHIST
SHALES AND
SLATES
(devold 01
carbonate)
1
3
....
I
1
I
1/ '1. . . . . __
298.5 mg I
mmo
....
- - -
Si02
11.56)
;~lom'4 i
2
.... . . . .
18 71
1
7
3
(1 .0)
4
5
100
6
6
==.-3
5
151
10.45)
1~~
5~
l?l5
38
509
GRANITE,
GNEISS
ANDESITE,
QUARTZ-DIORITE
BASALT
QUARTZITIC
SANDSTONE
LIMESTONE
Fig. 9.7. Major constituents of near-surface natural
groundwaters for some principal (nonevaporitic) rock
types. All analyses come from humid temperate regions and represent mean values in mg/I, meq/l, or
mmol/l (for Si0 2 which is dissolved as H 4 Si0 4 ). Wa9.2.3 Solute Transport of River Systems
(Mixed Rock Types)
Solute Concentrations in Rivers
Solute transport in rivers all over the world has been studied for many years (e.g. Walling and Webb 1986; Meybeck
1979, 1983, 1987; Degens et al. 1991; Sumrnerfield and
Hulton 1994, and many others).
Figure 9.8 shows the water chemistry ofmajor world
rivers. Most of the published data correspond to
ter chemistry of similar rock types may, however,
vary considerably from location to Iocation. (Data
from various sources, e.g., Matthess 1973; Georgotas
and Udluft 1978; Drever 1982; Hem 1983)
discharge-weighted mean values for one or several
years.
Modem pollution problems (see, e.g., Meybeck 1989) are
not discussed here.
The concentrations of total dissolved solids (TDS) of
large river systems vary between 33 and 880 mg/I. If
smaller catchments are included, TDS ranges from 58 mg/I (some tributaries of the Amazon river) to
more than 20 000 mg/I in rivers draining rock sequences with evaporites. Most rivers fall into the