

400
Chapter 8 Subsidence
INITIAL
THERMAL SUBSIDENCE
~Si-*-- - - - - - - - - St - - - - - - - - - - -
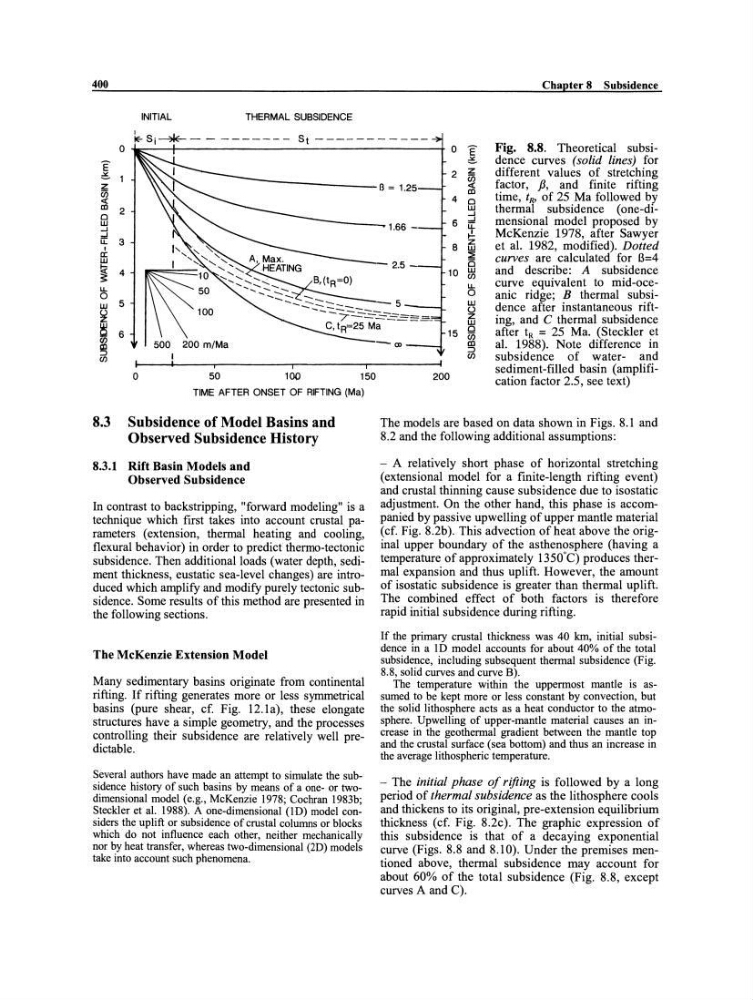
o -S:::---t--------------------+ 0 E Fig. 8.8. Theoretical sub siE
6
~
o
W
...J
:l
LL
I
CI:
w
!ci :
;::
LL
o
W
~
~
~
2
3
4
5
6
I
0
50
100
150
TIME AFTER ONSET OF RIFTING (Mal
8.3 Subsidence of Model Basins and
Observed Subsidence History
8.3.1 Rift Basin Models and
Observed Subsidence
In contrast to backstripping, "forward modeling" is a
technique which first takes into account crustal parameters (extension, thermal heating and cooling,
flexural behavior) in order to predict thermo-tectonic
subsidence. Then additional loads (water depth, sediment thickness, eustatic sea-Ievel changes) are introduced which amplify and modify purely tectonic subsidence. Some results of this method are presented in
the following sections.
The McKenzie Extension Model
Many sedimentary basins originate from continental
rifting. If rifting generates more or less symmetrical
basins (pure shear, cf. Fig. 12.1a), these elongate
structures have a simple geometry, and the processes
controlling their subsidence are relatively weIl predictable.
Several authors have made an attempt to simulate the subsidence history of such basins by means of a one- or twodimensional model (e.g., McKenzie 1978; Cochran 1983b;
Steckler et al. 1988). A one-dimensional (ID) model considers the uplift or subsidence of crustal columns or blocks
which do not influence each other, neither mechanically
nor by heat transfer, whereas two-dimensional (2D) models
take into account such phenomena.
ß = 1.25
1.66 -
- 2.5-'"
2
4
6
B
10
15
,
200
6
dence curves (solid lines) for
different values of stretching
factor, ß, and finite rifting
time, lRJ of 25 Ma followed by
thermal subsidence (one-dimensional model proposed by
McKenzie 1978, after Sawyer
et al. 1982, modified). Dotted
curves are calculated for ß=4
and describe: A subsidence
curve equivalent to mid-oceanic ridge; B thermal subsidence after instantaneous rifting, and ethermal subsidence
after t R = 25 Ma. (Steckler et
al. 1988). Note difference in
subsidence of water- and
sediment-filled basin (amplification factor 2.5, see text)
z
Ci)
«
co
0
w
...J
:l
LL
t!z w
~
0
w
CI)
LL
0
w
Ü
z w
Q
CI)
co
:::J
CI)
The models are based on data shown in Figs. 8.1 and
8.2 and the following additional assumptions:
- A relatively short phase of horizontal stretching
(extensional model for a finite-Iength rifting event)
and crustal thinning cause subsidence due to isostatic
adjustment. On the other hand, this phase is accompanied by passive upwelling of upper mantIe material
(cf. Fig. 8.2b). This advection ofheat above the original upper boundary of the asthenosphere (having a
temperature of approxirnately 1350"C) produces thermal expansion and thus uplift. However, the amount
of isostatic subsidence is greater than thennal uplift.
The combined effect of both factors is therefore
rapid initial subsidence during rifting.
If the primary crustal thickness was 40 km, initial subsidence in a ID model ac counts for about 40% of the total
subsidence, incIuding subsequent thermal subsidence (Fig.
8.8, solid curves and curve B).
The temperature within the uppermost mantle is assumed to be kept more or less constant by convection, but
the solid lithosphere acts as a heat conductor to the atrnosphere. Upwelling of upper-mantle material causes an increase in the geothermal gradient between the mantle top
and the crustal surface (sea bottom) and thus an increase in
the average lithospheric temperature.
- The initial phase of rifting is followed by a long
period of thermal subsidence as the lithosphere cools
and thickens to its original, pre-extension equilibrium
thickness (cf. Fig. 8.2c). The graphic expression of
this subsidence is that of a decaying exponential
curve (Figs. 8.8 and 8.10). Under the premises mentioned above, thennal subsidence may account for
about 60% of the total subsidence (Fig. 8.8, except
curves A and C).
Chapter 8 Subsidence
INITIAL
THERMAL SUBSIDENCE
~Si-*-- - - - - - - - - St - - - - - - - - - - -
o -S:::---t--------------------+ 0 E Fig. 8.8. Theoretical sub siE
6
~
o
W
...J
:l
LL
I
CI:
w
!ci :
;::
LL
o
W
~
~
~
2
3
4
5
6
I
0
50
100
150
TIME AFTER ONSET OF RIFTING (Mal
8.3 Subsidence of Model Basins and
Observed Subsidence History
8.3.1 Rift Basin Models and
Observed Subsidence
In contrast to backstripping, "forward modeling" is a
technique which first takes into account crustal parameters (extension, thermal heating and cooling,
flexural behavior) in order to predict thermo-tectonic
subsidence. Then additional loads (water depth, sediment thickness, eustatic sea-Ievel changes) are introduced which amplify and modify purely tectonic subsidence. Some results of this method are presented in
the following sections.
The McKenzie Extension Model
Many sedimentary basins originate from continental
rifting. If rifting generates more or less symmetrical
basins (pure shear, cf. Fig. 12.1a), these elongate
structures have a simple geometry, and the processes
controlling their subsidence are relatively weIl predictable.
Several authors have made an attempt to simulate the subsidence history of such basins by means of a one- or twodimensional model (e.g., McKenzie 1978; Cochran 1983b;
Steckler et al. 1988). A one-dimensional (ID) model considers the uplift or subsidence of crustal columns or blocks
which do not influence each other, neither mechanically
nor by heat transfer, whereas two-dimensional (2D) models
take into account such phenomena.
ß = 1.25
1.66 -
- 2.5-'"
2
4
6
B
10
15
,
200
6
dence curves (solid lines) for
different values of stretching
factor, ß, and finite rifting
time, lRJ of 25 Ma followed by
thermal subsidence (one-dimensional model proposed by
McKenzie 1978, after Sawyer
et al. 1982, modified). Dotted
curves are calculated for ß=4
and describe: A subsidence
curve equivalent to mid-oceanic ridge; B thermal subsidence after instantaneous rifting, and ethermal subsidence
after t R = 25 Ma. (Steckler et
al. 1988). Note difference in
subsidence of water- and
sediment-filled basin (amplification factor 2.5, see text)
z
Ci)
«
co
0
w
...J
:l
LL
t!z w
~
0
w
CI)
LL
0
w
Ü
z w
Q
CI)
co
:::J
CI)
The models are based on data shown in Figs. 8.1 and
8.2 and the following additional assumptions:
- A relatively short phase of horizontal stretching
(extensional model for a finite-Iength rifting event)
and crustal thinning cause subsidence due to isostatic
adjustment. On the other hand, this phase is accompanied by passive upwelling of upper mantIe material
(cf. Fig. 8.2b). This advection ofheat above the original upper boundary of the asthenosphere (having a
temperature of approxirnately 1350"C) produces thermal expansion and thus uplift. However, the amount
of isostatic subsidence is greater than thennal uplift.
The combined effect of both factors is therefore
rapid initial subsidence during rifting.
If the primary crustal thickness was 40 km, initial subsidence in a ID model ac counts for about 40% of the total
subsidence, incIuding subsequent thermal subsidence (Fig.
8.8, solid curves and curve B).
The temperature within the uppermost mantle is assumed to be kept more or less constant by convection, but
the solid lithosphere acts as a heat conductor to the atrnosphere. Upwelling of upper-mantle material causes an increase in the geothermal gradient between the mantle top
and the crustal surface (sea bottom) and thus an increase in
the average lithospheric temperature.
- The initial phase of rifting is followed by a long
period of thermal subsidence as the lithosphere cools
and thickens to its original, pre-extension equilibrium
thickness (cf. Fig. 8.2c). The graphic expression of
this subsidence is that of a decaying exponential
curve (Figs. 8.8 and 8.10). Under the premises mentioned above, thennal subsidence may account for
about 60% of the total subsidence (Fig. 8.8, except
curves A and C).