

186
K.Edelvang
between 0 and 49 mg 1-1. In Fig. 17.3a all the sampling points are consistent with the
hindcast plots. The suspended sediment concentration varies from 0 to 10 mg 1-1 in the
hindcast compared to 6 to 11 mg 1-1 in the measured data points. Thus, the measured
values compare well with those of the hindcast, both with respect to the concentration
levels and the position of the plume. In Fig. 17.3b the simulated concentrations are again
very close to the measured concentrations, ranging from 0 to 50 mg 1-1 in the hindcast
and 0 to 49 mg 1-1 in the measured data. The position of the model plume is close to the
actual plume. Control samples taken outside the plume area showed concentrations of
<1 mg I-I, supporting the evidence that the model prediction is valid.
(Gridspacing 500 m)
160
150
140
130
120
)4,.
110
E
100
8 II> 90
en
c
·0
to
~ 80
"0
!2. 70
60
50
40
30
o1f
/,
20
/ 1
10
. . ~
0
0
10
20
30
40
50
60
70
80
90
100 11 0 120
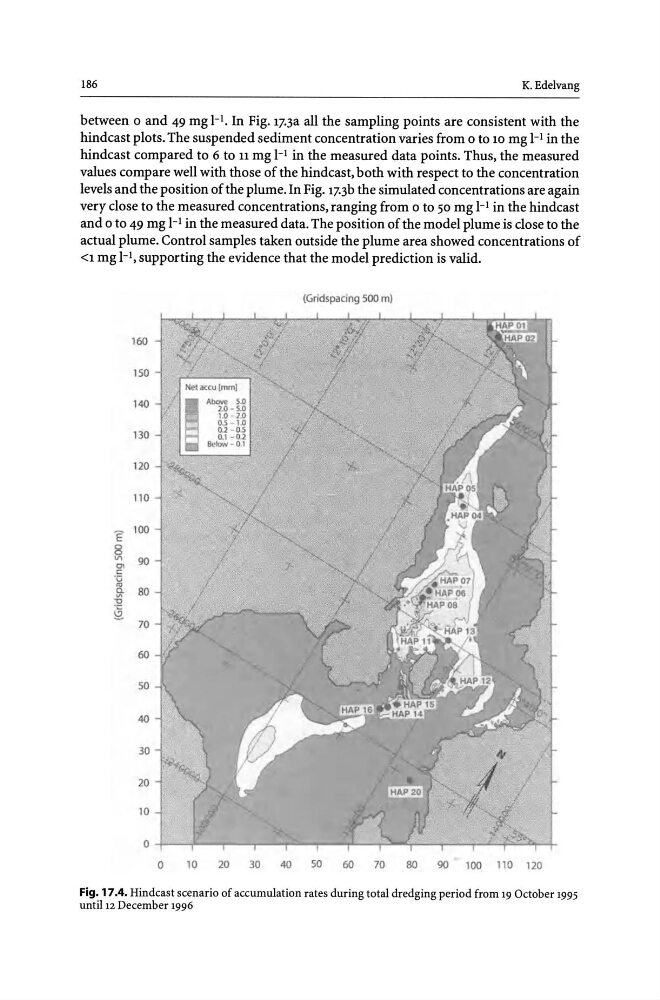
Fig. 17.4. Hindcast scenario of accumulation rates during total dredging period from 19 October 1995
until 12 December 1996
K.Edelvang
between 0 and 49 mg 1-1. In Fig. 17.3a all the sampling points are consistent with the
hindcast plots. The suspended sediment concentration varies from 0 to 10 mg 1-1 in the
hindcast compared to 6 to 11 mg 1-1 in the measured data points. Thus, the measured
values compare well with those of the hindcast, both with respect to the concentration
levels and the position of the plume. In Fig. 17.3b the simulated concentrations are again
very close to the measured concentrations, ranging from 0 to 50 mg 1-1 in the hindcast
and 0 to 49 mg 1-1 in the measured data. The position of the model plume is close to the
actual plume. Control samples taken outside the plume area showed concentrations of
<1 mg I-I, supporting the evidence that the model prediction is valid.
(Gridspacing 500 m)
160
150
140
130
120
)4,.
110
E
100
8 II> 90
en
c
·0
to
~ 80
"0
!2. 70
60
50
40
30
o1f
/,
20
/ 1
10
. . ~
0
0
10
20
30
40
50
60
70
80
90
100 11 0 120
Fig. 17.4. Hindcast scenario of accumulation rates during total dredging period from 19 October 1995
until 12 December 1996