

4 Extraction of Intermediate Scale Sea Ice Deformation Parameters from SAR Ice Motion Products
79
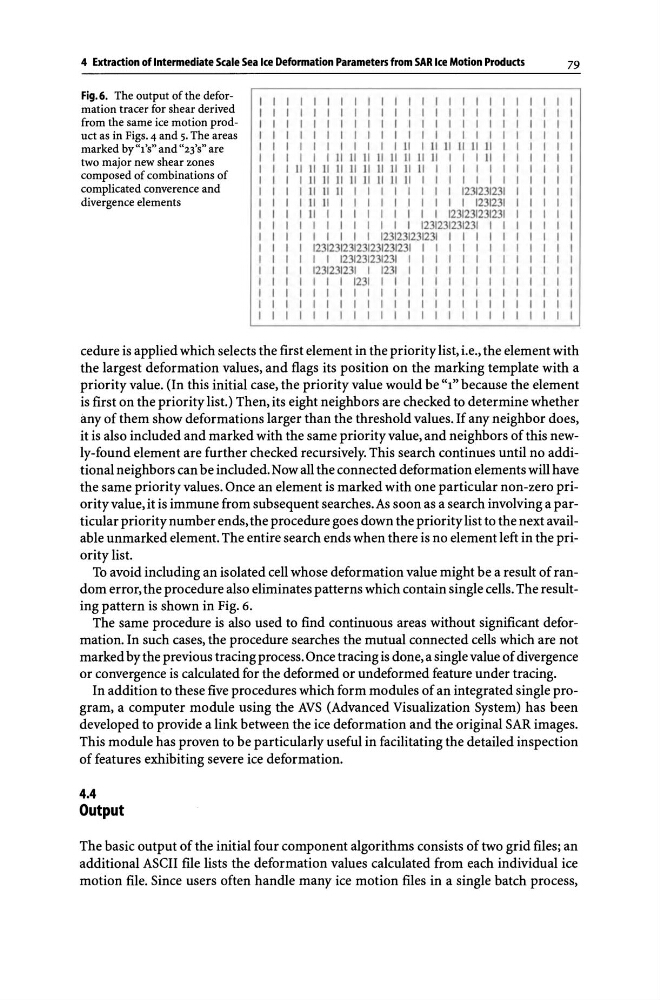
Fig. 6. The output ofthe deformation tracer for shear derived
from the same ice motion product as in Figs. 4 and 5. The areas
marked by "l'S" and "23'S" are
two major new shear zones
composed of combinations of
complicated converence and
divergence elements
I
I
I
I
I
1
I
I
I
I
I
I
I
I
I
I
I
I
I
I
I I
I I
I I
I I
I
I
I
I
I I
I I
I I I I
I I I I I I I
I
I I
I I
I I I I I I I I I I I
I
I I
I I I I I I I I I I I I I
I
I I
I I I I I I I I
I I I I I I
I I
I I I I I II I II II II II II I
1
I I
II II II II II II II II I I I II I
I
II II
1I II 11 II 11 II II I 1 I I I I
I
I II
11 II II II II II I I I I I I I
I
III
II I I I I
I I
I I 1231231231
I
I II
I I I I I I I I I I 1231231
1
I II
I I 1 I I 1 I I 1231231231231
I
I I I I I I I
I I
1231231231231 I I
I
I I I I I 1 1231231231231 1 1 I 1 1
I
I 1231231231231231231231 1 I I 1 I I I
I
I I I 1231231231231 1 I I
1 I I I I
I
I 1231231231 I 1 231 1 I I
1 I I I I
I
I 1 I I 1231 I I I I I 1 I I I I
I
I 1 I
I I I
I I I
I I
I I
I I I
I
I 1 I I I I I I I I I I I I I I
I
1
I 1 I I I 1 I I I
1 I I I 1 I I
I
1
cedure is applied which selects the first element in the priority list, i.e., the element with
the largest deformation values, and flags its position on the marking template with a
priority value. (In this initial case, the priority value would be "1" because the element
is first on the priority list.) Then, its eight neighbors are checked to determine whether
any of them show deformations larger than the threshold values. If any neighbor does,
it is also included and marked with the same priority value, and neighbors of this newly-found element are further checked recursively. This search continues until no additional neighbors can be included. Now all the connected deformation elements will have
the same priority values. Once an element is marked with one particular non-zero priority value, it is immune from subsequent searches. As soon as a search involving a particular priority number ends, the procedure goes down the priority list to the next available unmarked element. The entire search ends when there is no element left in the priority list.
To avoid including an isolated cell whose deformation value might be a result of random error, the procedure also eliminates patterns which contain single cells. The resulting pattern is shown in Fig. 6.
The same procedure is also used to find continuous areas without significant deformation. In such cases, the procedure searches the mutual connected cells which are not
marked by the previous tracing process. Once tracing is done, a single value of divergence
or convergence is calculated for the deformed or undeformed feature under tracing.
In addition to these five procedures which form modules of an integrated single program, a computer module using the AVS (Advanced Visualization System) has been
developed to provide a link between the ice deformation and the original SAR images.
This module has proven to be particularly useful in facilitating the detailed inspection
of features exhibiting severe ice deformation.
4.4
Output
The basic output of the initial four component algorithms consists of two grid files; an
additional ASCII file lists the deformation values calculated from each individual ice
motion file. Since users often handle many ice motion files in a single batch process,
79
Fig. 6. The output ofthe deformation tracer for shear derived
from the same ice motion product as in Figs. 4 and 5. The areas
marked by "l'S" and "23'S" are
two major new shear zones
composed of combinations of
complicated converence and
divergence elements
I
I
I
I
I
1
I
I
I
I
I
I
I
I
I
I
I
I
I
I
I I
I I
I I
I I
I
I
I
I
I I
I I
I I I I
I I I I I I I
I
I I
I I
I I I I I I I I I I I
I
I I
I I I I I I I I I I I I I
I
I I
I I I I I I I I
I I I I I I
I I
I I I I I II I II II II II II I
1
I I
II II II II II II II II I I I II I
I
II II
1I II 11 II 11 II II I 1 I I I I
I
I II
11 II II II II II I I I I I I I
I
III
II I I I I
I I
I I 1231231231
I
I II
I I I I I I I I I I 1231231
1
I II
I I 1 I I 1 I I 1231231231231
I
I I I I I I I
I I
1231231231231 I I
I
I I I I I 1 1231231231231 1 1 I 1 1
I
I 1231231231231231231231 1 I I 1 I I I
I
I I I 1231231231231 1 I I
1 I I I I
I
I 1231231231 I 1 231 1 I I
1 I I I I
I
I 1 I I 1231 I I I I I 1 I I I I
I
I 1 I
I I I
I I I
I I
I I
I I I
I
I 1 I I I I I I I I I I I I I I
I
1
I 1 I I I 1 I I I
1 I I I 1 I I
I
1
cedure is applied which selects the first element in the priority list, i.e., the element with
the largest deformation values, and flags its position on the marking template with a
priority value. (In this initial case, the priority value would be "1" because the element
is first on the priority list.) Then, its eight neighbors are checked to determine whether
any of them show deformations larger than the threshold values. If any neighbor does,
it is also included and marked with the same priority value, and neighbors of this newly-found element are further checked recursively. This search continues until no additional neighbors can be included. Now all the connected deformation elements will have
the same priority values. Once an element is marked with one particular non-zero priority value, it is immune from subsequent searches. As soon as a search involving a particular priority number ends, the procedure goes down the priority list to the next available unmarked element. The entire search ends when there is no element left in the priority list.
To avoid including an isolated cell whose deformation value might be a result of random error, the procedure also eliminates patterns which contain single cells. The resulting pattern is shown in Fig. 6.
The same procedure is also used to find continuous areas without significant deformation. In such cases, the procedure searches the mutual connected cells which are not
marked by the previous tracing process. Once tracing is done, a single value of divergence
or convergence is calculated for the deformed or undeformed feature under tracing.
In addition to these five procedures which form modules of an integrated single program, a computer module using the AVS (Advanced Visualization System) has been
developed to provide a link between the ice deformation and the original SAR images.
This module has proven to be particularly useful in facilitating the detailed inspection
of features exhibiting severe ice deformation.
4.4
Output
The basic output of the initial four component algorithms consists of two grid files; an
additional ASCII file lists the deformation values calculated from each individual ice
motion file. Since users often handle many ice motion files in a single batch process,