

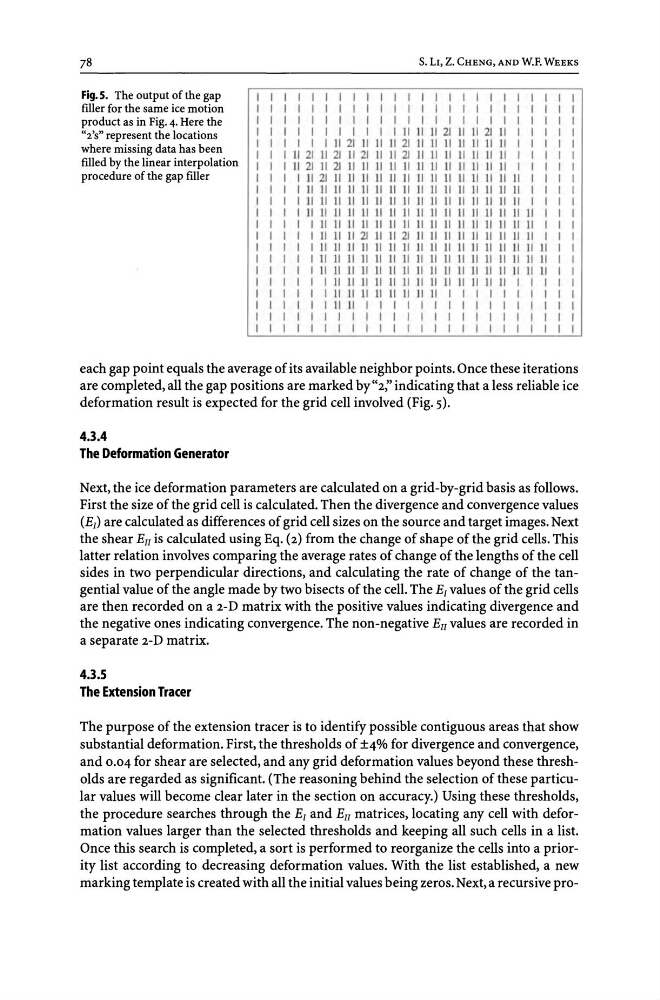
Fig.5. The output of the gap
filler for the same ice motion
product as in Fig. 4. Here the
"2'S" represent the locations
where missing data has been
filled by the linear interpolation
procedure of the gap filler
I
I
I
I
I
I
I
I
I
I
I
I
I
I
I
I
I
I
I
I
I
I
I
I
I
I
I
I
I
I
I
I
I
I
1
1
I
I
I
I
I
I
S. LI, Z. CHENG, AND W.F. WEEKS
I I I I I I I I I I I I I I I I I I
I
I I I I I I I I I I I I I I I I I I
I
I I I I I I I I I I I I I I I I I I
I
I I I I I I I I 11111 II 21 II II 21 II I
I
I I I I 1/ 21 1/ 1/ 1/ 21 1/ II II 1/ 1/ II 1/ I
I
I 11 21 II 21 II 21 1/ 1/ 21 II II II II II 1/ II I
I
111211121111/ 1/ II II II II II II II II II I
I
I
II 21 1/ II 1/ 11 II 1/ 1/ 1/ II 1/ II II 1/ II
I
I
11 1/ 1/ 11 11 11 11 11 1/ 1/ 11 11 11 11 II II
I
I
11 1/ II 1/ 11 11 1/ II 1/ 11 11 11 11 11 11 II
I
I
II 11 11 11 11 11 11 II 11 11 11 11 11 11 11 11
I
I
I 11 II 11 II II 11 II 11 11 11 11 II II 11 11
I
I
111111/21 11 II 21 11 II 11 1/ II II II II II
I
I
1 11 11 11 II II 1/ II 1/ 11 11 11 11 II II II II II I I
I
1 1/ 11 1/ II II II 1/ II 1/ 11 11 11 II II II II II I I
I
I II II II 1/ 1/ II II II 11 II 11 II II II II II II I I
I
I I II II 11 11 II II 11 II 11 II II II II I I I I I
I
I I II 11 11 11 II II II 11 I I I I I I I I I I
I
I I II 11 I I I I I I I I I I I I I I I I
I
I I I I I I I I I I I I I I I I I I I I
I
I I I I I 1 1 I 1 I I I I I I I I I 1 I
each gap point equals the average of its available neighbor points. Once these iterations
are completed, all the gap positions are marked by "2;' indicating that a less reliable ice
deformation result is expected for the grid cell involved (Fig. 5).
4.3.4
The Deformation Generator
Next, the ice deformation parameters are calculated on a grid-by-grid basis as follows.
First the size of the grid cell is calculated. Then the divergence and convergence values
(Er) are calculated as differences of grid cell sizes on the source and target images. Next
the shear Ell is calculated using Eq. (2) from the change of shape of the grid cells. This
latter relation involves comparing the average rates of change of the lengths of the cell
sides in two perpendicular directions, and calculating the rate of change of the tangential value of the angle made by two bisects of the cell. The Er values of the grid cells
are then recorded on a 2-D matrix with the positive values indicating divergence and
the negative ones indicating convergence. The non-negative Ell values are recorded in
a separate 2-D matrix.
4.3.5
The Extension Tracer
The purpose of the extension tracer is to identify possible contiguous areas that show
substantial deformation. First, the thresholds of ±4% for divergence and convergence,
and 0.04 for shear are selected, and any grid deformation values beyond these thresholds are regarded as significant. (The reasoning behind the selection of these particular values will become clear later in the section on accuracy.) Using these thresholds,
the procedure searches through the Er and Ell matrices, locating any cell with deformation values larger than the selected thresholds and keeping all such cells in a list.
Once this search is completed, a sort is performed to reorganize the cells into a priority list according to decreasing deformation values. With the list established, a new
marking template is created with all the initial values being zeros. Next, a recursive pro-
filler for the same ice motion
product as in Fig. 4. Here the
"2'S" represent the locations
where missing data has been
filled by the linear interpolation
procedure of the gap filler
I
I
I
I
I
I
I
I
I
I
I
I
I
I
I
I
I
I
I
I
I
I
I
I
I
I
I
I
I
I
I
I
I
I
1
1
I
I
I
I
I
I
S. LI, Z. CHENG, AND W.F. WEEKS
I I I I I I I I I I I I I I I I I I
I
I I I I I I I I I I I I I I I I I I
I
I I I I I I I I I I I I I I I I I I
I
I I I I I I I I 11111 II 21 II II 21 II I
I
I I I I 1/ 21 1/ 1/ 1/ 21 1/ II II 1/ 1/ II 1/ I
I
I 11 21 II 21 II 21 1/ 1/ 21 II II II II II 1/ II I
I
111211121111/ 1/ II II II II II II II II II I
I
I
II 21 1/ II 1/ 11 II 1/ 1/ 1/ II 1/ II II 1/ II
I
I
11 1/ 1/ 11 11 11 11 11 1/ 1/ 11 11 11 11 II II
I
I
11 1/ II 1/ 11 11 1/ II 1/ 11 11 11 11 11 11 II
I
I
II 11 11 11 11 11 11 II 11 11 11 11 11 11 11 11
I
I
I 11 II 11 II II 11 II 11 11 11 11 II II 11 11
I
I
111111/21 11 II 21 11 II 11 1/ II II II II II
I
I
1 11 11 11 II II 1/ II 1/ 11 11 11 11 II II II II II I I
I
1 1/ 11 1/ II II II 1/ II 1/ 11 11 11 II II II II II I I
I
I II II II 1/ 1/ II II II 11 II 11 II II II II II II I I
I
I I II II 11 11 II II 11 II 11 II II II II I I I I I
I
I I II 11 11 11 II II II 11 I I I I I I I I I I
I
I I II 11 I I I I I I I I I I I I I I I I
I
I I I I I I I I I I I I I I I I I I I I
I
I I I I I 1 1 I 1 I I I I I I I I I 1 I
each gap point equals the average of its available neighbor points. Once these iterations
are completed, all the gap positions are marked by "2;' indicating that a less reliable ice
deformation result is expected for the grid cell involved (Fig. 5).
4.3.4
The Deformation Generator
Next, the ice deformation parameters are calculated on a grid-by-grid basis as follows.
First the size of the grid cell is calculated. Then the divergence and convergence values
(Er) are calculated as differences of grid cell sizes on the source and target images. Next
the shear Ell is calculated using Eq. (2) from the change of shape of the grid cells. This
latter relation involves comparing the average rates of change of the lengths of the cell
sides in two perpendicular directions, and calculating the rate of change of the tangential value of the angle made by two bisects of the cell. The Er values of the grid cells
are then recorded on a 2-D matrix with the positive values indicating divergence and
the negative ones indicating convergence. The non-negative Ell values are recorded in
a separate 2-D matrix.
4.3.5
The Extension Tracer
The purpose of the extension tracer is to identify possible contiguous areas that show
substantial deformation. First, the thresholds of ±4% for divergence and convergence,
and 0.04 for shear are selected, and any grid deformation values beyond these thresholds are regarded as significant. (The reasoning behind the selection of these particular values will become clear later in the section on accuracy.) Using these thresholds,
the procedure searches through the Er and Ell matrices, locating any cell with deformation values larger than the selected thresholds and keeping all such cells in a list.
Once this search is completed, a sort is performed to reorganize the cells into a priority list according to decreasing deformation values. With the list established, a new
marking template is created with all the initial values being zeros. Next, a recursive pro-