

3 Role of SAR in Surface Energy Flux Measurements Over Sea Ice
3.4.3.2
Results
61
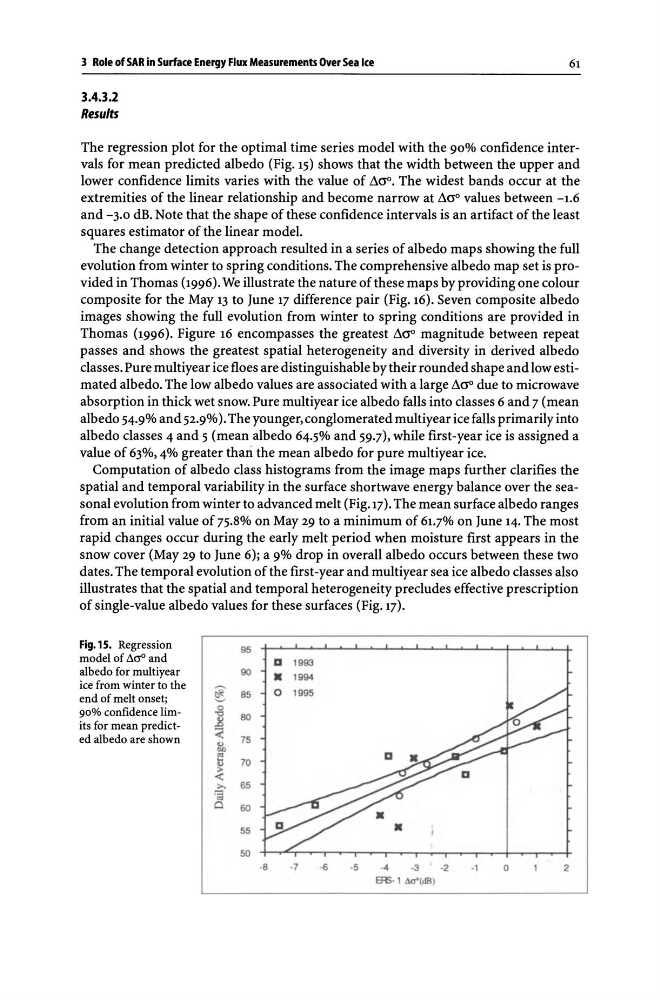
The regression plot for the optimal time series model with the 90% confidence intervals for mean predicted albedo (Fig. 15) shows that the width between the upper and
lower confidence limits varies with the value of ~ao. The widest bands occur at the
extremities of the linear relationship and become narrow at ~ao values between -1.6
and -3.0 dB. Note that the shape of these confidence intervals is an artifact of the least
squares estimator of the linear model.
The change detection approach resulted in a series of albedo maps showing the full
evolution from winter to spring conditions. The comprehensive albedo map set is provided in Thomas (1996). We illustrate the nature of these maps by providing one colour
composite for the May 13 to June 17 difference pair (Fig. 16). Seven composite albedo
images showing the full evolution from winter to spring conditions are provided in
Thomas (1996). Figure 16 encompasses the greatest ~cro magnitude between repeat
passes and shows the greatest spatial heterogeneity and diversity in derived albedo
classes. Pure multiyear ice floes are distinguishable by their rounded shape and low estimated albedo. The low albedo values are associated with a large ~ao due to microwave
absorption in thick wet snow. Pure multiyear ice albedo falls into classes 6 and 7 (mean
albedo 54.9% and 52.9%). The younger, conglomerated multiyear ice falls primarily into
albedo classes 4 and 5 (mean albedo 64.5% and 59.7), while first-year ice is assigned a
value of 63%, 4% greater than the mean albedo for pure multiyear ice.
Computation of albedo class histograms from the image maps further clarifies the
spatial and temporal variability in the surface shortwave energy balance over the seasonal evolution from winter to advanced melt (Fig. 17 ). The mean surface albedo ranges
from an initial value of 75.8% on May 29 to a minimum of 61.7% on June 14. The most
rapid changes occur during the early melt period when moisture first appears in the
snow cover (May 29 to June 6); a 9% drop in overall albedo occurs between these two
dates. The temporal evolution of the first-year and multiyear sea ice albedo classes also
illustrates that the spatial and temporal heterogeneity precludes effective prescription
of single-value albedo values for these surfaces (Fig. 17).
Fig.15. Regression
95
model of .1.cr o and
a 1993
albedo for multiyear
90
•
1994
ice from winter to the
~
end of melt onset;
85
90% confidence limo
E
BO
its for mean predicted albedo are shown
:( 75
"
OJ)
~ 70
>
«
>.
65
~
C
60
55
50
-B
-7
-6
-5
-4
-3
-2
-1
0
2
ER;. 1 4
3.4.3.2
Results
61
The regression plot for the optimal time series model with the 90% confidence intervals for mean predicted albedo (Fig. 15) shows that the width between the upper and
lower confidence limits varies with the value of ~ao. The widest bands occur at the
extremities of the linear relationship and become narrow at ~ao values between -1.6
and -3.0 dB. Note that the shape of these confidence intervals is an artifact of the least
squares estimator of the linear model.
The change detection approach resulted in a series of albedo maps showing the full
evolution from winter to spring conditions. The comprehensive albedo map set is provided in Thomas (1996). We illustrate the nature of these maps by providing one colour
composite for the May 13 to June 17 difference pair (Fig. 16). Seven composite albedo
images showing the full evolution from winter to spring conditions are provided in
Thomas (1996). Figure 16 encompasses the greatest ~cro magnitude between repeat
passes and shows the greatest spatial heterogeneity and diversity in derived albedo
classes. Pure multiyear ice floes are distinguishable by their rounded shape and low estimated albedo. The low albedo values are associated with a large ~ao due to microwave
absorption in thick wet snow. Pure multiyear ice albedo falls into classes 6 and 7 (mean
albedo 54.9% and 52.9%). The younger, conglomerated multiyear ice falls primarily into
albedo classes 4 and 5 (mean albedo 64.5% and 59.7), while first-year ice is assigned a
value of 63%, 4% greater than the mean albedo for pure multiyear ice.
Computation of albedo class histograms from the image maps further clarifies the
spatial and temporal variability in the surface shortwave energy balance over the seasonal evolution from winter to advanced melt (Fig. 17 ). The mean surface albedo ranges
from an initial value of 75.8% on May 29 to a minimum of 61.7% on June 14. The most
rapid changes occur during the early melt period when moisture first appears in the
snow cover (May 29 to June 6); a 9% drop in overall albedo occurs between these two
dates. The temporal evolution of the first-year and multiyear sea ice albedo classes also
illustrates that the spatial and temporal heterogeneity precludes effective prescription
of single-value albedo values for these surfaces (Fig. 17).
Fig.15. Regression
95
model of .1.cr o and
a 1993
albedo for multiyear
90
•
1994
ice from winter to the
~
end of melt onset;
85
90% confidence limo
E
BO
its for mean predicted albedo are shown
:( 75
"
OJ)
~ 70
>
«
>.
65
~
C
60
55
50
-B
-7
-6
-5
-4
-3
-2
-1
0
2
ER;. 1 4