

272
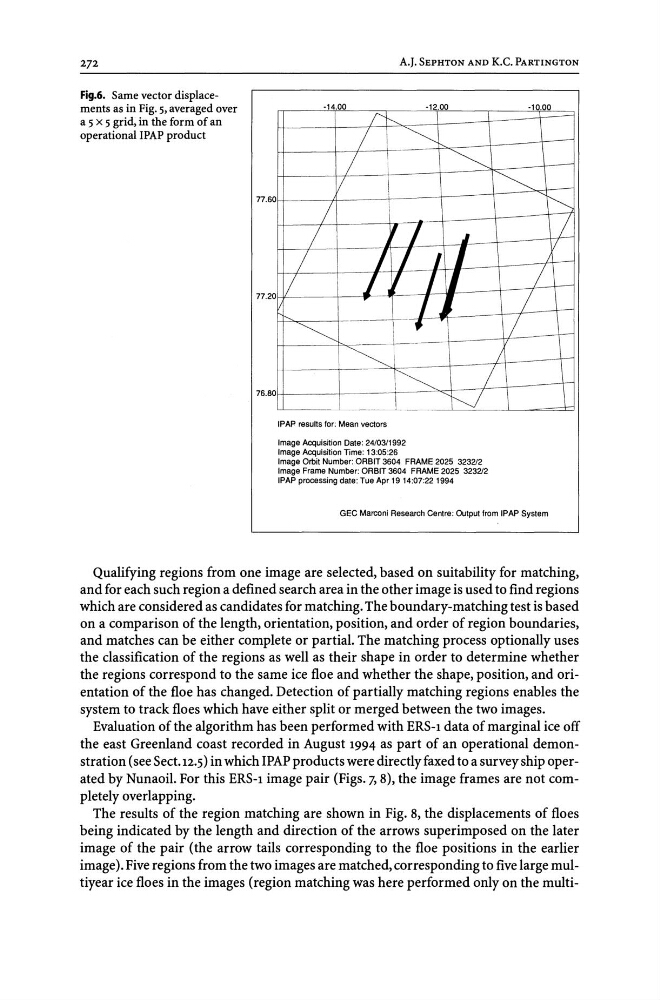
Fig.6. Same vector displacements as in Fig. 5, averaged over
a 5 x 5 grid, in the form of an
operational IPAP product
77.60
77.20
76.80
A.J. SEPHTON AND K.c. PARTINGTON
·14.00
·12.00
-10.00
~
/ I ~
/
~
~
i
/
!
~
~
/
1
L
/
I I "
I
/
/ ! I I I
L
/
I if I I
--I .. r
L
--,- ,
/
~
,
-r-----1
/
r--- '
/
Ii
-1\"J
____ L
IPAP results for: Mean vectors
Image Acquisition Date: 24/03/1992
Image Acquisition Time: 13:05:26
Image Orbil Number: ORBIT 3604 FRAME 2025 3232/2
Image Frame Number: ORBIT 3604 FRAME 2025 3232/2
IPAP processing date: Tue Apr 19 14:07:22 t 994
GEe Marconi Research Centre: Output from IPAP System
Qualifying regions from one image are selected, based on suitability for matching,
and for each such region a defined search area in the other image is used to find regions
which are considered as candidates for matching. The boundary-matching test is based
on a comparison of the length, orientation, position, and order of region boundaries,
and matches can be either complete or partial. The matching process optionally uses
the classification of the regions as well as their shape in order to determine whether
the regions correspond to the same ice floe and whether the shape, position, and orientation of the floe has changed. Detection of partially matching regions enables the
system to track floes which have either split or merged between the two images.
Evaluation of the algorithm has been performed with ERS-1 data of marginal ice off
the east Greenland coast recorded in August 1994 as part of an operational demonstration (see SeCt.I2.5) in which IPAP products were directly faxed to a survey ship operated by Nunaoil. For this ERS-1 image pair (Figs. 7, 8), the image frames are not completelyoverlapping.
The results of tlte region matching are shown in Fig. 8, the displacements of floes
being indicated by the length and direction of the arrows superimposed on the later
image of the pair (the arrow tails corresponding to the floe positions in the earlier
image). Five regions from the two images are matched, corresponding to five large multiyear ice floes in the images (region matching was here performed only on the multi-
Fig.6. Same vector displacements as in Fig. 5, averaged over
a 5 x 5 grid, in the form of an
operational IPAP product
77.60
77.20
76.80
A.J. SEPHTON AND K.c. PARTINGTON
·14.00
·12.00
-10.00
~
/ I ~
/
~
~
i
/
!
~
~
/
1
L
/
I I "
I
/
/ ! I I I
L
/
I if I I
--I .. r
L
--,- ,
/
~
,
-r-----1
/
r--- '
/
Ii
-1\"J
____ L
IPAP results for: Mean vectors
Image Acquisition Date: 24/03/1992
Image Acquisition Time: 13:05:26
Image Orbil Number: ORBIT 3604 FRAME 2025 3232/2
Image Frame Number: ORBIT 3604 FRAME 2025 3232/2
IPAP processing date: Tue Apr 19 14:07:22 t 994
GEe Marconi Research Centre: Output from IPAP System
Qualifying regions from one image are selected, based on suitability for matching,
and for each such region a defined search area in the other image is used to find regions
which are considered as candidates for matching. The boundary-matching test is based
on a comparison of the length, orientation, position, and order of region boundaries,
and matches can be either complete or partial. The matching process optionally uses
the classification of the regions as well as their shape in order to determine whether
the regions correspond to the same ice floe and whether the shape, position, and orientation of the floe has changed. Detection of partially matching regions enables the
system to track floes which have either split or merged between the two images.
Evaluation of the algorithm has been performed with ERS-1 data of marginal ice off
the east Greenland coast recorded in August 1994 as part of an operational demonstration (see SeCt.I2.5) in which IPAP products were directly faxed to a survey ship operated by Nunaoil. For this ERS-1 image pair (Figs. 7, 8), the image frames are not completelyoverlapping.
The results of tlte region matching are shown in Fig. 8, the displacements of floes
being indicated by the length and direction of the arrows superimposed on the later
image of the pair (the arrow tails corresponding to the floe positions in the earlier
image). Five regions from the two images are matched, corresponding to five large multiyear ice floes in the images (region matching was here performed only on the multi-