

11 The RADARSAT Geophysical Processor System
251
the peak value dips below a predetermined threshold. We estimate the date of melt onset
to be the time when the temporally interpolated peak crosses this threshold. The freezeup algorithm also tracks the peak of the backscattering histogram. When this peak
remains above a specified threshold for a period of N days, the date of freeze-up is estimated at M days prior to the threshold crossing. The details and physical basis for these
algorithms are discussed by Winebrenner (this volume).
11.3
RGPS Products
In this section, we describe how the time series of sea ice data are stored and how the
products are synthesized from the basic observations of ice motion and backscatter.
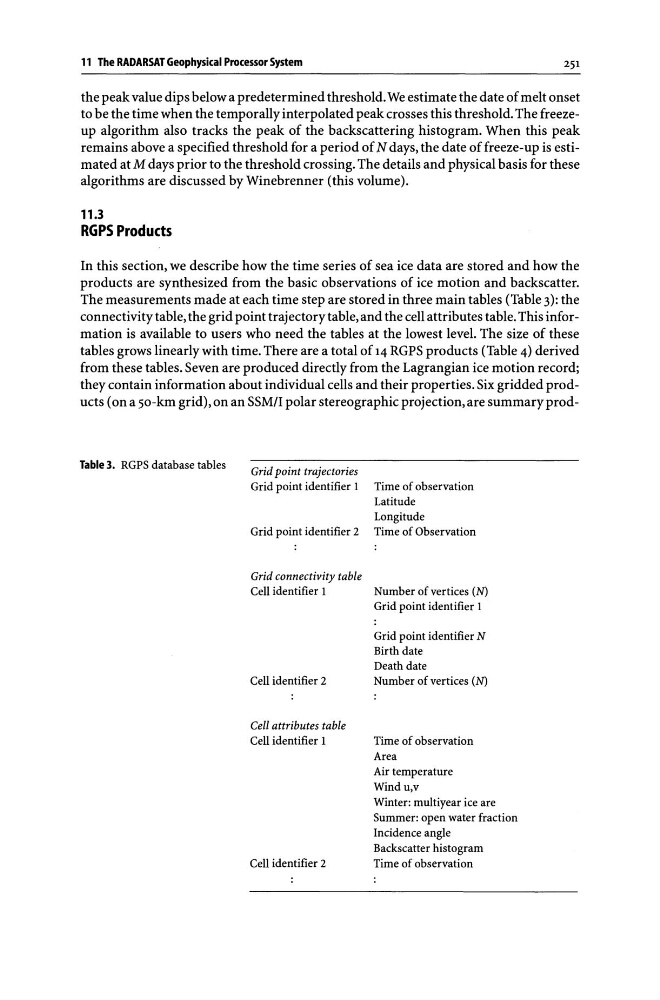
The measurements made at each time step are stored in three main tables (Table 3): the
connectivity table, the grid point trajectory table, and the cell attributes table. This information is available to users who need the tables at the lowest level. The size of these
tables grows linearly with time. There are a total of 14 RGPS products (Table 4) derived
from these tables. Seven are produced directly from the Lagrangian ice motion record;
they contain information about individual cells and their properties. Six gridded products (on a 50-km grid), on an SSM!I polar stereo graphic projection, are summary prodTable 3. RGPS database tables
Grid point trajectories
Grid point identifier 1 Time of observation
Latitude
Longitude
Grid point identifier 2 Time of Observation
Grid connectivity table
Cell identifier 1
Number of vertices (N)
Grid point identifier 1
Cell identifier 2
Cell attributes table
Cell identifier 1
Cell identifier 2
Grid point identifier N
Birth date
Death date
Number of vertices (N)
Time of observation
Area
Air temperature
Wind u,v
Winter: multiyear ice are
Summer: open water fraction
Incidence angle
Backscatter histogram
Time of observation
251
the peak value dips below a predetermined threshold. We estimate the date of melt onset
to be the time when the temporally interpolated peak crosses this threshold. The freezeup algorithm also tracks the peak of the backscattering histogram. When this peak
remains above a specified threshold for a period of N days, the date of freeze-up is estimated at M days prior to the threshold crossing. The details and physical basis for these
algorithms are discussed by Winebrenner (this volume).
11.3
RGPS Products
In this section, we describe how the time series of sea ice data are stored and how the
products are synthesized from the basic observations of ice motion and backscatter.
The measurements made at each time step are stored in three main tables (Table 3): the
connectivity table, the grid point trajectory table, and the cell attributes table. This information is available to users who need the tables at the lowest level. The size of these
tables grows linearly with time. There are a total of 14 RGPS products (Table 4) derived
from these tables. Seven are produced directly from the Lagrangian ice motion record;
they contain information about individual cells and their properties. Six gridded products (on a 50-km grid), on an SSM!I polar stereo graphic projection, are summary prodTable 3. RGPS database tables
Grid point trajectories
Grid point identifier 1 Time of observation
Latitude
Longitude
Grid point identifier 2 Time of Observation
Grid connectivity table
Cell identifier 1
Number of vertices (N)
Grid point identifier 1
Cell identifier 2
Cell attributes table
Cell identifier 1
Cell identifier 2
Grid point identifier N
Birth date
Death date
Number of vertices (N)
Time of observation
Area
Air temperature
Wind u,v
Winter: multiyear ice are
Summer: open water fraction
Incidence angle
Backscatter histogram
Time of observation