

, 0 Polar SAR Data for Operational Sea Ice Mapping
2 17
As experience with radar imagery for ice analysis has expanded, radar analysts have
become adept at determining ice concentrations and types from subtle clues in the
imagery. The strong return from wind-roughened open water that confused early ERS-l
analysts has become an analysis tool with the knowledge that new ice forming in the
water dampens the small surface waves, reducing the radar return dramatically. The
distinctive wispy shapes depicting ice have become well recognized, even when tone is
most definitely non-ice-like.
10.5.2
SAR Image (lues to Ice Stage of Development
New ice begins to form when sea water temperatures reach approximately -1.9 ·C.
Remote detection of new ice had been nearly impossible from visible and infrared sensors in use at the various ice centers prior to the advent of SAR. It has been proven that
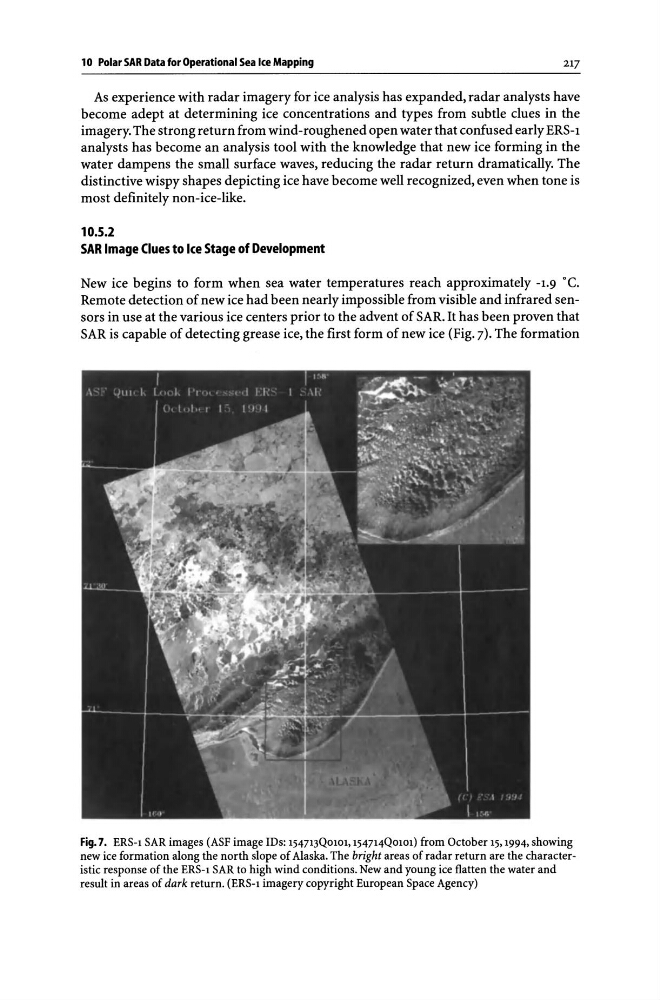
SAR is capable of detecting grease ice, the first form of new ice (Fig. 7). The formation
Fig. 7. ERS-l SAR images (ASF image IDs: 154713Q0101, 154714Q0101) from October 15, 1994, showing
new ice formation along the north slope of Alaska. The bright areas of radar return are the characteristic response of the ERS-l SAR to high wind conditions. New and young ice flatten the water and
result in areas of dark return. (ERS-l imagery copyright European Space Agency)
2 17
As experience with radar imagery for ice analysis has expanded, radar analysts have
become adept at determining ice concentrations and types from subtle clues in the
imagery. The strong return from wind-roughened open water that confused early ERS-l
analysts has become an analysis tool with the knowledge that new ice forming in the
water dampens the small surface waves, reducing the radar return dramatically. The
distinctive wispy shapes depicting ice have become well recognized, even when tone is
most definitely non-ice-like.
10.5.2
SAR Image (lues to Ice Stage of Development
New ice begins to form when sea water temperatures reach approximately -1.9 ·C.
Remote detection of new ice had been nearly impossible from visible and infrared sensors in use at the various ice centers prior to the advent of SAR. It has been proven that
SAR is capable of detecting grease ice, the first form of new ice (Fig. 7). The formation
Fig. 7. ERS-l SAR images (ASF image IDs: 154713Q0101, 154714Q0101) from October 15, 1994, showing
new ice formation along the north slope of Alaska. The bright areas of radar return are the characteristic response of the ERS-l SAR to high wind conditions. New and young ice flatten the water and
result in areas of dark return. (ERS-l imagery copyright European Space Agency)