

8 Satellite Microwave Radar Observations of Antarctic Sea Ice
177
inally developed for the winter Arctic can be used without serious problems in both
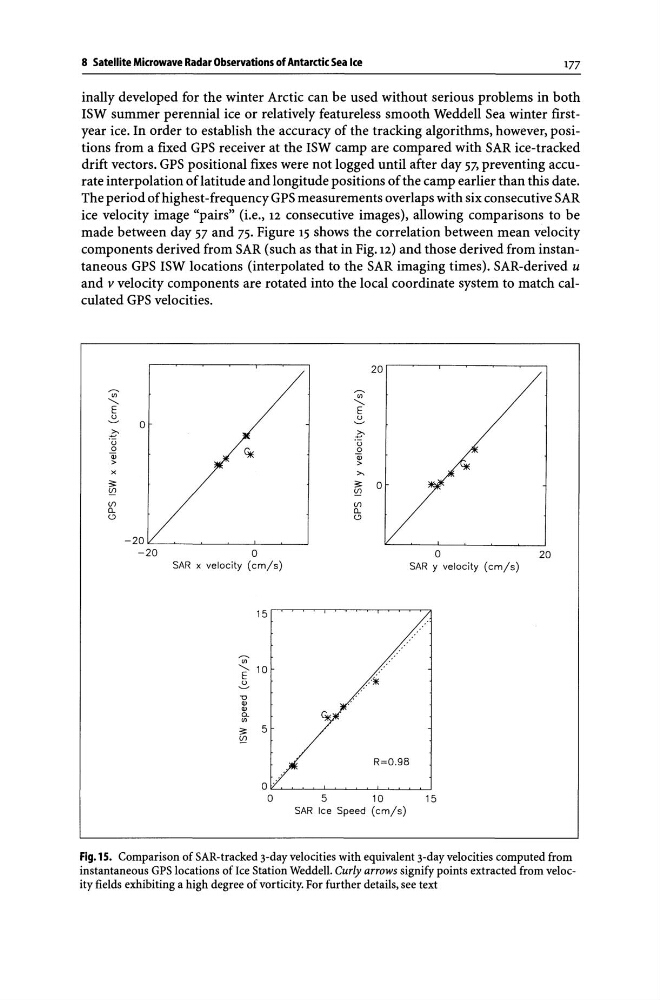
ISW summer perennial ice or relatively featureless smooth Weddell Sea winter firstyear ice. In order to establish the accuracy of the tracking algorithms, however, positions from a fixed GPS receiver at the ISW camp are compared with SAR ice-tracked
drift vectors. GPS positional fixes were not logged until after day 57, preventing accurate interpolation oflatitude and longitude positions of the camp earlier than this date.
The period of highest -frequency GPS measurements overlaps with six consecutive SAR
ice velocity image "pairs" (i.e., 12 consecutive images), allowing comparisons to be
made between day 57 and 75. Figure 15 shows the correlation between mean velocity
components derived from SAR (such as that in Fig. 12) and those derived from instantaneous GPS ISW locations (interpolated to the SAR imaging times). SAR-derived u
and v velocity components are rotated into the local coordinate system to match calculated GPS velocities.
Vi'
"E
~
.?;'u
~
3:
~
(f)
D<.:>
0
-20~~ __ ~ __ ~ __ - L __ ~~
-20
0
SAR x velocity (em/s)
en
E- 10
~
20
Vi'
"- E
~
.?;'u 0
OJ
>
'"'
3: 0
~
(f)
D<.:>
o
20
SAR Y velocity (em/s)
R=0.98
O~~~~~~~-L~~~
o
5
10
15
SAR Ice Speed (em/s)
Fig.15. Comparison of SAR-tracked 3-day velocities with equivalent 3-day velocities computed from
instantaneous GPS locations of Ice Station Weddell. Curly arrows signify points extracted from velocity fields exhibiting a high degree of vorticity. For further details, see text
177
inally developed for the winter Arctic can be used without serious problems in both
ISW summer perennial ice or relatively featureless smooth Weddell Sea winter firstyear ice. In order to establish the accuracy of the tracking algorithms, however, positions from a fixed GPS receiver at the ISW camp are compared with SAR ice-tracked
drift vectors. GPS positional fixes were not logged until after day 57, preventing accurate interpolation oflatitude and longitude positions of the camp earlier than this date.
The period of highest -frequency GPS measurements overlaps with six consecutive SAR
ice velocity image "pairs" (i.e., 12 consecutive images), allowing comparisons to be
made between day 57 and 75. Figure 15 shows the correlation between mean velocity
components derived from SAR (such as that in Fig. 12) and those derived from instantaneous GPS ISW locations (interpolated to the SAR imaging times). SAR-derived u
and v velocity components are rotated into the local coordinate system to match calculated GPS velocities.
Vi'
"E
~
.?;'u
~
3:
~
(f)
D<.:>
0
-20~~ __ ~ __ ~ __ - L __ ~~
-20
0
SAR x velocity (em/s)
en
E- 10
~
20
Vi'
"- E
~
.?;'u 0
OJ
>
'"'
3: 0
~
(f)
D<.:>
o
20
SAR Y velocity (em/s)
R=0.98
O~~~~~~~-L~~~
o
5
10
15
SAR Ice Speed (em/s)
Fig.15. Comparison of SAR-tracked 3-day velocities with equivalent 3-day velocities computed from
instantaneous GPS locations of Ice Station Weddell. Curly arrows signify points extracted from velocity fields exhibiting a high degree of vorticity. For further details, see text