

152
M.R. DRINKWATER
Weddell Sea. Amarclica
50.0W
40.0 W 30.0 W 20.0 W 10.0 W
-.
55.0
. 60.05
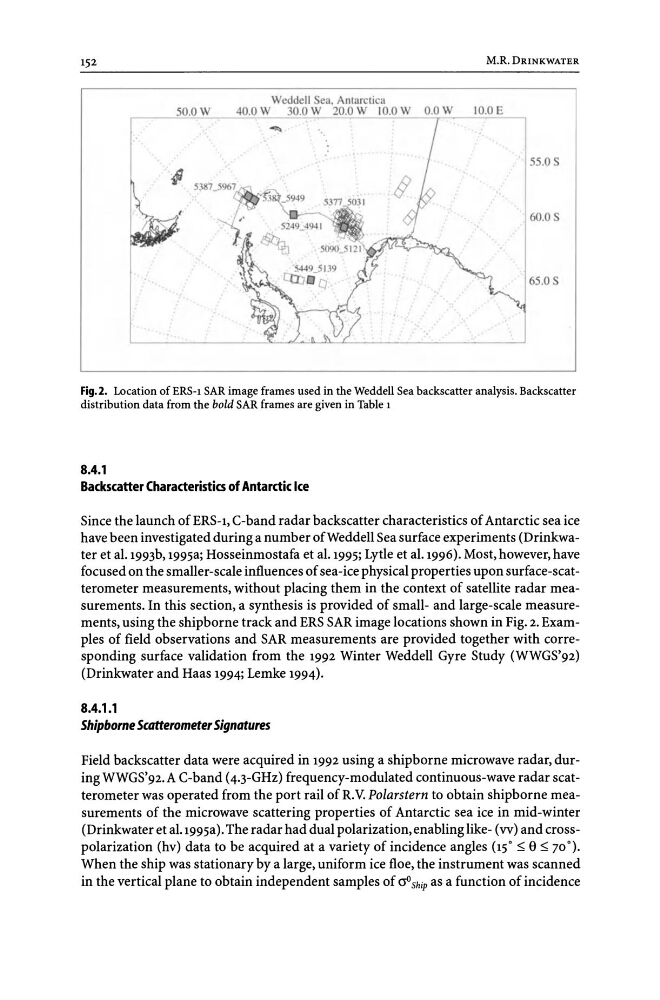
Fig. 2. Location of ERS-l SAR image frames used in the Weddell Sea backscatter analysis. Backscatter
distribution data from the bold SAR frames are given in Table 1
8.4.1
Backscatter Characteristics of Antarctic Ice
Since the launch of ERS-l, C-band radar backscatter characteristics of Antarctic sea ice
have been investigated during a number of Weddell Sea surface experiments (Drinkwater et al. 1993b, 1995a; Hosseinmostafa et al. 1995; Lytle et al. 1996). Most, however, have
focused on the smaller-scale influences of sea-ice physical properties upon surface-scatterometer measurements, without placing them in the context of satellite radar measurements. In this section, a synthesis is provided of small- and large-scale measurements, using the shipborne track and ERS SAR image locations shown in Fig. 2. Examples of field observations and SAR measurements are provided together with corresponding surface validation from the 1992 Winter Weddell Gyre Study (WWGS'92)
(Drinkwater and Haas 1994; Lemke 1994).
8.4.1.1
Shipborne Scatterometer Signatures
Field backscatter data were acquired in 1992 using a shipborne microwave radar, during WWGS'92. A C-band (4.3-GHz) frequency-modulated continuous-wave radar scatterometer was operated from the port rail of R.V. Polarstern to obtain shipborne measurements of the microwave scattering properties of Antarctic sea ice in mid-winter
(Drinkwater et al.1995a). The radar had dual polarization, enabling like- (vv) and crosspolarization (hv) data to be acquired at a variety of incidence angles (15° ~ e ~ 70°).
When the ship was stationary by a large, uniform ice floe, the instrument was scanned
in the vertical plane to obtain independent samples of crOShip as a function of incidence
M.R. DRINKWATER
Weddell Sea. Amarclica
50.0W
40.0 W 30.0 W 20.0 W 10.0 W
-.
55.0
. 60.05
Fig. 2. Location of ERS-l SAR image frames used in the Weddell Sea backscatter analysis. Backscatter
distribution data from the bold SAR frames are given in Table 1
8.4.1
Backscatter Characteristics of Antarctic Ice
Since the launch of ERS-l, C-band radar backscatter characteristics of Antarctic sea ice
have been investigated during a number of Weddell Sea surface experiments (Drinkwater et al. 1993b, 1995a; Hosseinmostafa et al. 1995; Lytle et al. 1996). Most, however, have
focused on the smaller-scale influences of sea-ice physical properties upon surface-scatterometer measurements, without placing them in the context of satellite radar measurements. In this section, a synthesis is provided of small- and large-scale measurements, using the shipborne track and ERS SAR image locations shown in Fig. 2. Examples of field observations and SAR measurements are provided together with corresponding surface validation from the 1992 Winter Weddell Gyre Study (WWGS'92)
(Drinkwater and Haas 1994; Lemke 1994).
8.4.1.1
Shipborne Scatterometer Signatures
Field backscatter data were acquired in 1992 using a shipborne microwave radar, during WWGS'92. A C-band (4.3-GHz) frequency-modulated continuous-wave radar scatterometer was operated from the port rail of R.V. Polarstern to obtain shipborne measurements of the microwave scattering properties of Antarctic sea ice in mid-winter
(Drinkwater et al.1995a). The radar had dual polarization, enabling like- (vv) and crosspolarization (hv) data to be acquired at a variety of incidence angles (15° ~ e ~ 70°).
When the ship was stationary by a large, uniform ice floe, the instrument was scanned
in the vertical plane to obtain independent samples of crOShip as a function of incidence