

7 Mapping the Progression of Melt Onset and Freeze-Up
Fig.2. a ERS-l SAR image of a
representative ice region on
June 2,1992, near the buoy that
provided the data in Fig. 1. Temperatures were still well below
freezing. b A similar image of
the same ice scene on 15 June
1992, just after the onset of
melt. Equal gray levels in separate images connote equal
backscattering cross-sections.
The white rectangular regions
define sampling boxes used in
previous signature-change
study. (Copyright ESA 1992)
133
1Y'i2
© ESA IY'i2
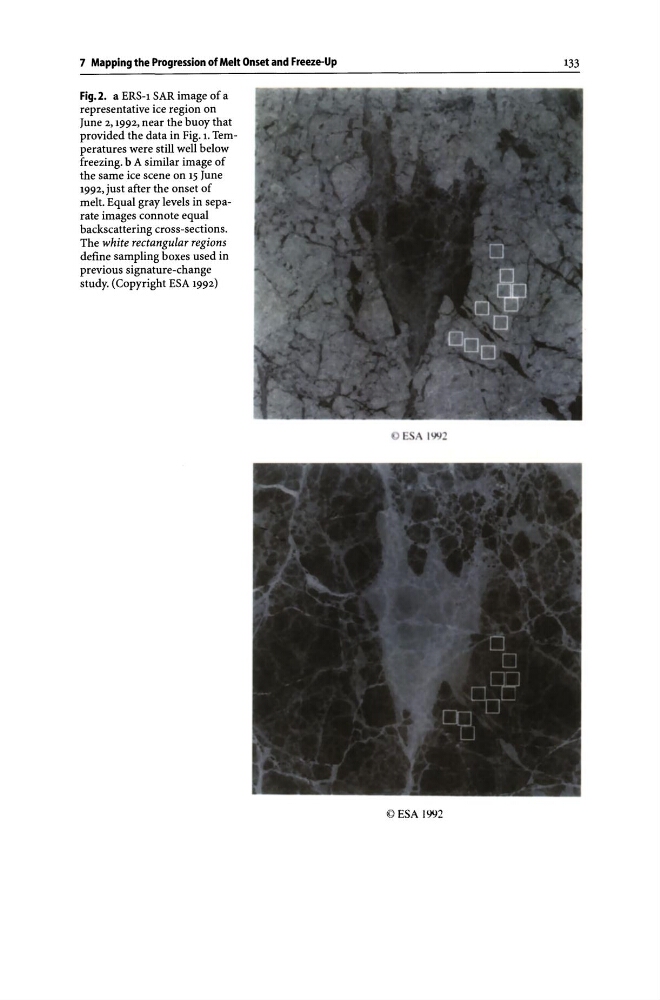
Fig.2. a ERS-l SAR image of a
representative ice region on
June 2,1992, near the buoy that
provided the data in Fig. 1. Temperatures were still well below
freezing. b A similar image of
the same ice scene on 15 June
1992, just after the onset of
melt. Equal gray levels in separate images connote equal
backscattering cross-sections.
The white rectangular regions
define sampling boxes used in
previous signature-change
study. (Copyright ESA 1992)
133
1Y'i2
© ESA IY'i2