

132
D.P. WINEBRENNER, D.G. LONG, B. HOLT
terometry appear to be mutually complementary. We conclude with a discussion of what
we believe to be the most important issues to be addressed in future work, both to extend
methods and to begin to address important geophysical questions using automated
methods.
7.2
Synopsis of Transition Date Mapping Using the ERS-l SAR
The essential phenomena on which automatable mapping of melt onset and freeze-up
relies are, respectively, the striking drop in multiyear ice 5.3-GHz backscattering cross
sections in spring, and the restabilization of those cross sections at relatively high winter values in the autumn.
As summarized in the Introduction, and discussed in detail by Winebrenner et al.
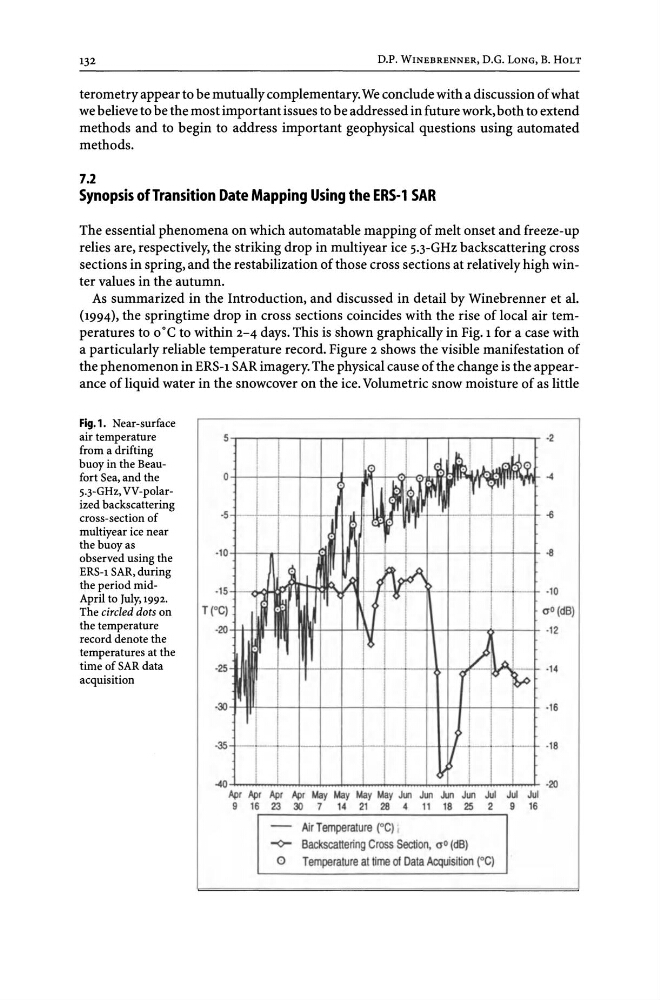
(1994), the springtime drop in cross sections coincides with the rise of local air temperatures to o·C to within 2-4 days. This is shown graphically in Fig. 1 for a case with
a particularly reliable temperature record. Figure 2 shows the visible manifestation of
the phenomenon in ERS-l SAR imagery. The physical cause of the change is the appearance of liquid water in the snowcover on the ice. Volumetric snow moisture of as little
Fig.1. Near-surface
air temperature
from a drifting
buoy in the Beaufort Sea, and the
5.3-GHz, VV-polarized backscattering
cross-section of
multiyear ice near
the buoy as
observed using the
ERS-l SAR, during
the period midApril to July, 1992.
The circled dots on
the temperature
record denote the
temperatures at the
time of SAR data
acquisition
~s
~I :A I~ ~ ~9.
~l.l : ~~ r'
;rill l'
<
T(
~
~~ !' r
~
A 9\> I leA
·15
111'
4 0
·C)
Jru
·20
11
~
l)
·25
A
J,
'{
q
f,.o
i
·35
-40
j
~
AfJr AfJr Apr AfJr May May May May JI.I'1 Jun Jun Jun Jul Jul Jul
9 16 23 30 7 14 21 28 4 11 18 25 2
9 16
Ai r T emperatu re (0G) I
~ Backscattering Cross Section, 00 (dB)
o Temperature at time ot Data Acquisition (0G)
·2
·10
00 (dB)
·12
·14
·16
·18
·20
D.P. WINEBRENNER, D.G. LONG, B. HOLT
terometry appear to be mutually complementary. We conclude with a discussion of what
we believe to be the most important issues to be addressed in future work, both to extend
methods and to begin to address important geophysical questions using automated
methods.
7.2
Synopsis of Transition Date Mapping Using the ERS-l SAR
The essential phenomena on which automatable mapping of melt onset and freeze-up
relies are, respectively, the striking drop in multiyear ice 5.3-GHz backscattering cross
sections in spring, and the restabilization of those cross sections at relatively high winter values in the autumn.
As summarized in the Introduction, and discussed in detail by Winebrenner et al.
(1994), the springtime drop in cross sections coincides with the rise of local air temperatures to o·C to within 2-4 days. This is shown graphically in Fig. 1 for a case with
a particularly reliable temperature record. Figure 2 shows the visible manifestation of
the phenomenon in ERS-l SAR imagery. The physical cause of the change is the appearance of liquid water in the snowcover on the ice. Volumetric snow moisture of as little
Fig.1. Near-surface
air temperature
from a drifting
buoy in the Beaufort Sea, and the
5.3-GHz, VV-polarized backscattering
cross-section of
multiyear ice near
the buoy as
observed using the
ERS-l SAR, during
the period midApril to July, 1992.
The circled dots on
the temperature
record denote the
temperatures at the
time of SAR data
acquisition
~s
~I :A I~ ~ ~9.
~l.l : ~~ r'
;rill l'
<
T(
~
~~ !' r
~
A 9\> I leA
·15
111'
4 0
·C)
Jru
·20
11
~
l)
·25
A
J,
'{
q
f,.o
i
·35
-40
j
~
AfJr AfJr Apr AfJr May May May May JI.I'1 Jun Jun Jun Jul Jul Jul
9 16 23 30 7 14 21 28 4 11 18 25 2
9 16
Ai r T emperatu re (0G) I
~ Backscattering Cross Section, 00 (dB)
o Temperature at time ot Data Acquisition (0G)
·2
·10
00 (dB)
·12
·14
·16
·18
·20