

116
A. K. Lm AND C. Y. PENG
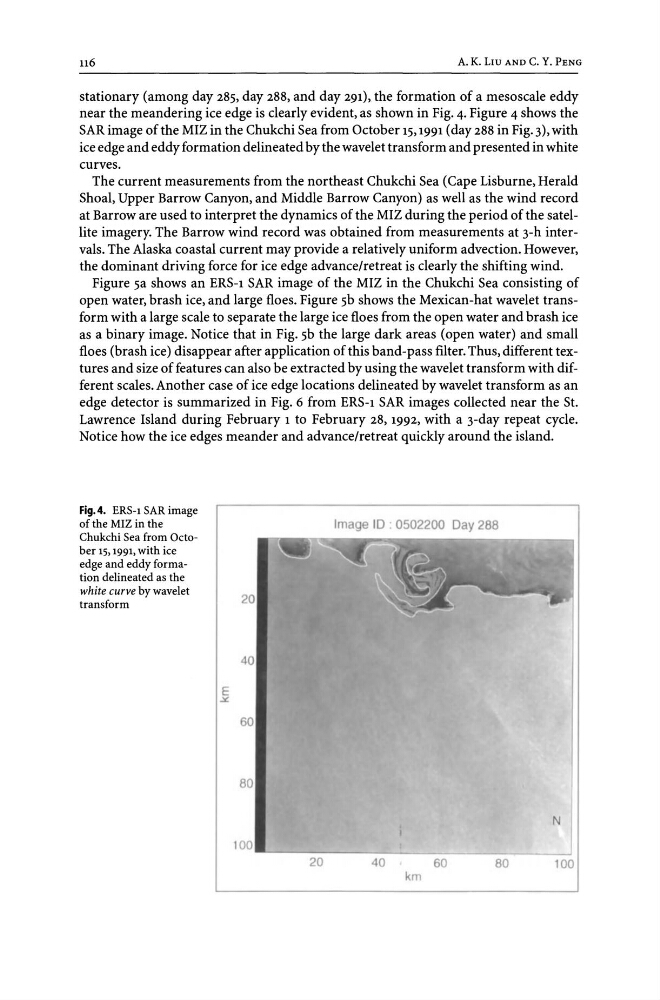
stationary (among day 285, day 288, and day 291), the formation of a mesoscale eddy
near the meandering ice edge is clearly evident, as shown in Fig. 4. Figure 4 shows the
SAR image of the MIZ in the Chukchi Sea from October 15,1991 (day 288 in Fig. 3), with
ice edge and eddy formation delineated by the wavelettransform and presented in white
curves.
The current measurements from the northeast Chukchi Sea (Cape Lisburne, Herald
Shoal, Upper Barrow Canyon, and Middle Barrow Canyon) as well as the wind record
at Barrow are used to interpret the dynamics of the MIZ during the period of the satellite imagery. The Barrow wind record was obtained from measurements at 3-h intervals. The Alaska coastal current may provide a relatively uniform advection. However,
the dominant driving force for ice edge advancelretreat is clearly the shifting wind.
Figure 5a shows an ERS-l SAR image of the MIZ in the Chukchi Sea consisting of
open water, brash ice, and large floes. Figure 5b shows the Mexican-hat wavelet transform with a large scale to separate the large ice floes from the open water and brash ice
as a binary image. Notice that in Fig. 5b the large dark areas (open water) and small
floes (brash ice) disappear after application of this band-pass filter. Thus, different textures and size of features can also be extracted by using the wavelet transform with different scales. Another case of ice edge locations delineated by wavelet transform as an
edge detector is summarized in Fig. 6 from ERS-l SAR images collected near the St.
Lawrence Island during February 1 to February 28, 1992, with a 3-day repeat cycle.
Notice how the ice edges meander and advancelretreat quickly around the island.
Fig.4. ERS-l SAR image
of the MIZ in the
Chukchi Sea from October 15, 1991, with ice
edge and eddy formation delineated as the
white curve by wavelet
transform
E
..>::
Image ID 0502200 Day 288
40
60
80
N
100
~ ________________________________ ~
20
40
60
80
100
km
A. K. Lm AND C. Y. PENG
stationary (among day 285, day 288, and day 291), the formation of a mesoscale eddy
near the meandering ice edge is clearly evident, as shown in Fig. 4. Figure 4 shows the
SAR image of the MIZ in the Chukchi Sea from October 15,1991 (day 288 in Fig. 3), with
ice edge and eddy formation delineated by the wavelettransform and presented in white
curves.
The current measurements from the northeast Chukchi Sea (Cape Lisburne, Herald
Shoal, Upper Barrow Canyon, and Middle Barrow Canyon) as well as the wind record
at Barrow are used to interpret the dynamics of the MIZ during the period of the satellite imagery. The Barrow wind record was obtained from measurements at 3-h intervals. The Alaska coastal current may provide a relatively uniform advection. However,
the dominant driving force for ice edge advancelretreat is clearly the shifting wind.
Figure 5a shows an ERS-l SAR image of the MIZ in the Chukchi Sea consisting of
open water, brash ice, and large floes. Figure 5b shows the Mexican-hat wavelet transform with a large scale to separate the large ice floes from the open water and brash ice
as a binary image. Notice that in Fig. 5b the large dark areas (open water) and small
floes (brash ice) disappear after application of this band-pass filter. Thus, different textures and size of features can also be extracted by using the wavelet transform with different scales. Another case of ice edge locations delineated by wavelet transform as an
edge detector is summarized in Fig. 6 from ERS-l SAR images collected near the St.
Lawrence Island during February 1 to February 28, 1992, with a 3-day repeat cycle.
Notice how the ice edges meander and advancelretreat quickly around the island.
Fig.4. ERS-l SAR image
of the MIZ in the
Chukchi Sea from October 15, 1991, with ice
edge and eddy formation delineated as the
white curve by wavelet
transform
E
..>::
Image ID 0502200 Day 288
40
60
80
N
100
~ ________________________________ ~
20
40
60
80
100
km