

6 Wavelet Analysis of SAR Images in the Marginal Ice Zone
Feature Tracking
Binary Images
Ice Edge
Ice Floe
113
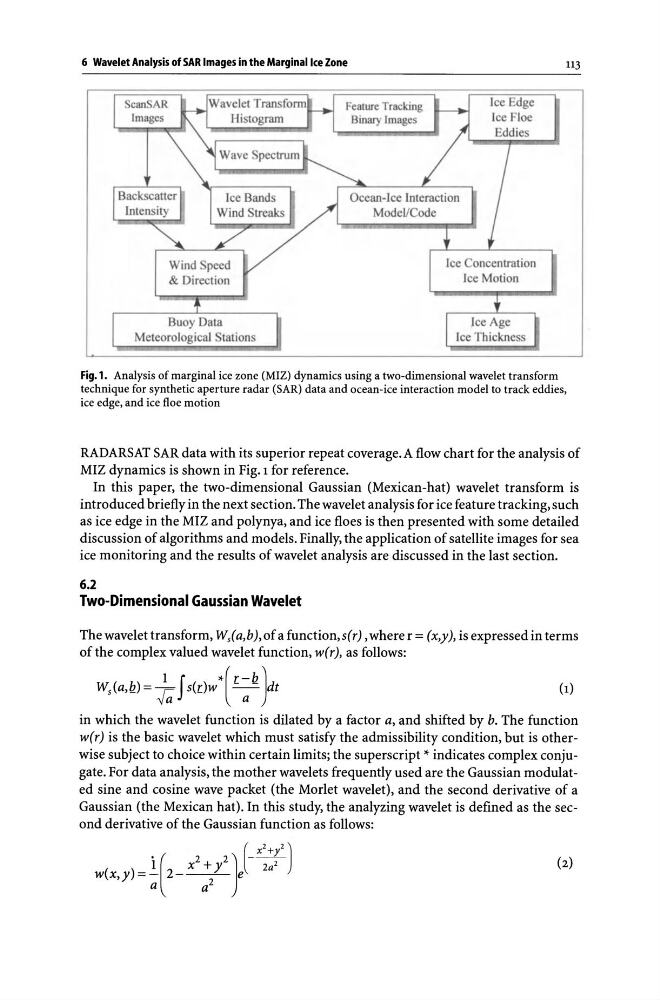
Fig.l. Analysis of marginal ice zone (MIZ) dynamics using a two-dimensional wavelet transform
technique for synthetic aperture radar (SAR) data and ocean-ice interaction model to track eddies,
ice edge, and ice floe motion
RADARS AT SAR data with its superior repeat coverage. A flow chart for the analysis of
MIZ dynamics is shown in Fig. 1 for reference.
In this paper, the two-dimensional Gaussian (Mexican-hat) wavelet transform is
introduced briefly in the next section. The wavelet analysis for ice feature tracking, such
as ice edge in the MIZ and polynya, and ice floes is then presented with some detailed
discussion of algorithms and models. Finally, the application of satellite images for sea
ice monitoring and the results of wavelet analysis are discussed in the last section.
6.2
Two-Dimensional Gaussian Wavelet
The wavelet transform, Wi a,b), of a function, s( r) , where r = (x,y), is expressed in terms
of the complex valued wavelet function, w( r), as follows:
1 f *(r-bJ
Ws(a,Q) = -Fa s(r)w - a - dt
in which the wavelet function is dilated by a factor a, and shifted by b. The function
w(r) is the basic wavelet which must satisfy the admissibility condition, but is otherwise subject to choice within certain limits; the superscript * indicates complex conjugate. For data analysis, the mother wavelets frequently used are the Gaussian modulated sine and cosine wave packet (the Modet wavelet), and the second derivative of a
Gaussian (the Mexican hat). In this study, the analyzing wavelet is defined as the second derivative of the Gaussian function as follows:
(
X2+y2 J
i
x2 + 2 -~-2W(X'Y)=-[2--y~Je 2a
a
a 2
Feature Tracking
Binary Images
Ice Edge
Ice Floe
113
Fig.l. Analysis of marginal ice zone (MIZ) dynamics using a two-dimensional wavelet transform
technique for synthetic aperture radar (SAR) data and ocean-ice interaction model to track eddies,
ice edge, and ice floe motion
RADARS AT SAR data with its superior repeat coverage. A flow chart for the analysis of
MIZ dynamics is shown in Fig. 1 for reference.
In this paper, the two-dimensional Gaussian (Mexican-hat) wavelet transform is
introduced briefly in the next section. The wavelet analysis for ice feature tracking, such
as ice edge in the MIZ and polynya, and ice floes is then presented with some detailed
discussion of algorithms and models. Finally, the application of satellite images for sea
ice monitoring and the results of wavelet analysis are discussed in the last section.
6.2
Two-Dimensional Gaussian Wavelet
The wavelet transform, Wi a,b), of a function, s( r) , where r = (x,y), is expressed in terms
of the complex valued wavelet function, w( r), as follows:
1 f *(r-bJ
Ws(a,Q) = -Fa s(r)w - a - dt
in which the wavelet function is dilated by a factor a, and shifted by b. The function
w(r) is the basic wavelet which must satisfy the admissibility condition, but is otherwise subject to choice within certain limits; the superscript * indicates complex conjugate. For data analysis, the mother wavelets frequently used are the Gaussian modulated sine and cosine wave packet (the Modet wavelet), and the second derivative of a
Gaussian (the Mexican hat). In this study, the analyzing wavelet is defined as the second derivative of the Gaussian function as follows:
(
X2+y2 J
i
x2 + 2 -~-2W(X'Y)=-[2--y~Je 2a
a
a 2