

224
5 Wave Evolution in Non-uniform Currents in Deep Water
y,km
300
----2
~---4
100
0~~~~~~~~~~~----~~
-100
J
-300
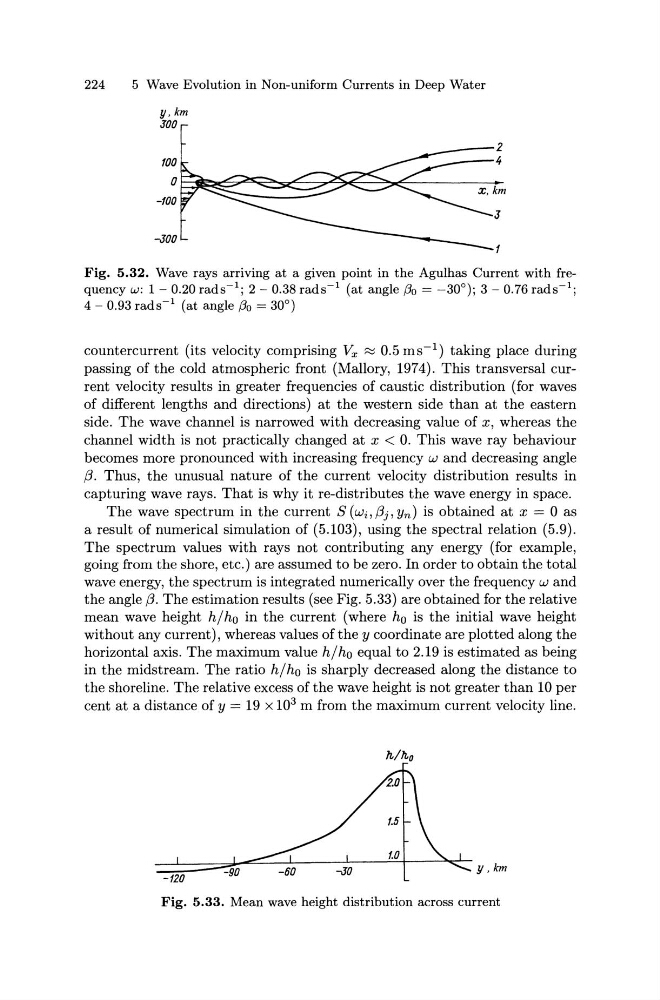
Fig. 5.32. Wave rays arriving at a given point in the Agulhas Current with frequency w: 1-0.20 rads- 1 ; 2-0.38 rads- 1 (at angle (30 = -30°); 3- 0.76 rads- 1 ;
4- 0.93 rads- 1 (at angle (30 = 30°)
countercurrent (its velocity comprising Vx ::::::: 0.5 ms- 1 ) taking place during
passing of the cold atmospheric front (Mallory, 1974). This transversal current velocity results in greater frequencies of caustic distribution (for waves
of different lengths and directions) at the western side than at the eastern
side. The wave channel is narrowed with decreasing value of x, whereas the
channel width is not practically changed at x < 0. This wave ray behaviour
becomes more pronounced with increasing frequency w and decreasing angle
{3. Thus, the unusual nature of the current velocity distribution results in
capturing wave rays. That is why it re-distributes the wave energy in space.
The wave spectrum in the current S ( wi, /3j, Yn) is obtained at x = 0 as
a result of numerical simulation of (5.103), using the spectral relation (5.9).
The spectrum values with rays not contributing any energy (for example,
going from the shore, etc.) are assumed to be zero. In order to obtain the total
wave energy, the spectrum is integrated numerically over the frequency w and
the angle {3. The estimation results (see Fig. 5.33) are obtained for the relative
mean wave height h/ho in the current (where h0 is the initial wave height
without any current), whereas values of they coordinate are plotted along the
horizontal axis. The maximum value h/ho equal to 2.19 is estimated as being
in the midstream. The ratio h / h0 is sharply decreased along the distance to
the shoreline. The relative excess of the wave height is not greater than 10 per
cent at a distance of y = 19 x 10 3 m from the maximum current velocity line.
Fig. 5.33. Mean wave height distribution across current
5 Wave Evolution in Non-uniform Currents in Deep Water
y,km
300
----2
~---4
100
0~~~~~~~~~~~----~~
-100
J
-300
Fig. 5.32. Wave rays arriving at a given point in the Agulhas Current with frequency w: 1-0.20 rads- 1 ; 2-0.38 rads- 1 (at angle (30 = -30°); 3- 0.76 rads- 1 ;
4- 0.93 rads- 1 (at angle (30 = 30°)
countercurrent (its velocity comprising Vx ::::::: 0.5 ms- 1 ) taking place during
passing of the cold atmospheric front (Mallory, 1974). This transversal current velocity results in greater frequencies of caustic distribution (for waves
of different lengths and directions) at the western side than at the eastern
side. The wave channel is narrowed with decreasing value of x, whereas the
channel width is not practically changed at x < 0. This wave ray behaviour
becomes more pronounced with increasing frequency w and decreasing angle
{3. Thus, the unusual nature of the current velocity distribution results in
capturing wave rays. That is why it re-distributes the wave energy in space.
The wave spectrum in the current S ( wi, /3j, Yn) is obtained at x = 0 as
a result of numerical simulation of (5.103), using the spectral relation (5.9).
The spectrum values with rays not contributing any energy (for example,
going from the shore, etc.) are assumed to be zero. In order to obtain the total
wave energy, the spectrum is integrated numerically over the frequency w and
the angle {3. The estimation results (see Fig. 5.33) are obtained for the relative
mean wave height h/ho in the current (where h0 is the initial wave height
without any current), whereas values of they coordinate are plotted along the
horizontal axis. The maximum value h/ho equal to 2.19 is estimated as being
in the midstream. The ratio h / h0 is sharply decreased along the distance to
the shoreline. The relative excess of the wave height is not greater than 10 per
cent at a distance of y = 19 x 10 3 m from the maximum current velocity line.
Fig. 5.33. Mean wave height distribution across current