

222
5 Wave Evolution in Non-uniform Currents in Deep Water
-180
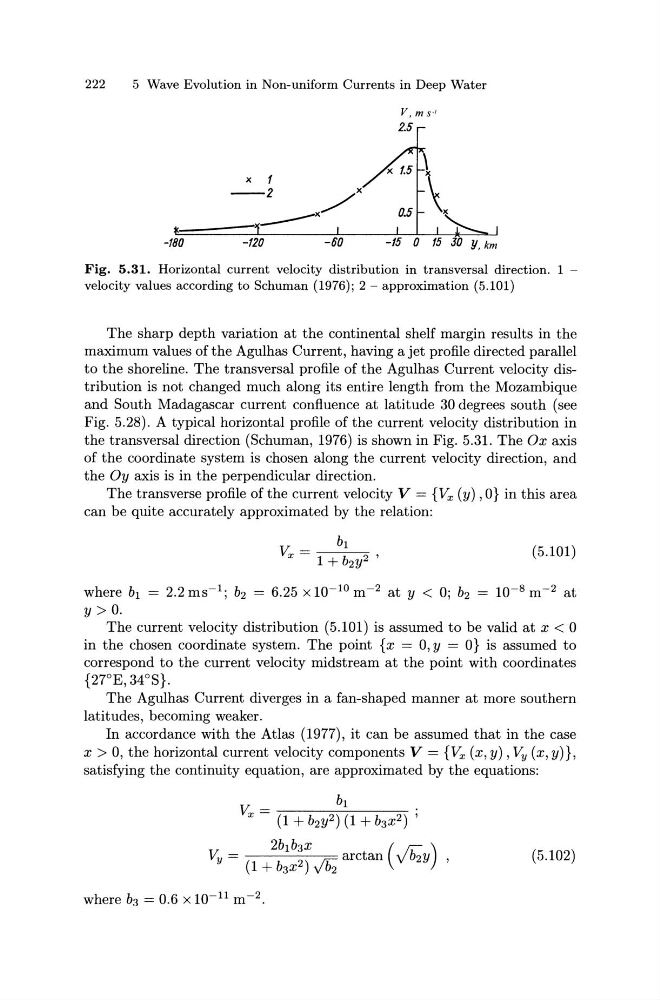
Fig. 5.31. Horizontal current velocity distribution in transversal direction. 1 -
velocity values according to Schuman (1976); 2- approximation (5.101)
The sharp depth variation at the continental shelf margin results in the
maximum values of the Agulhas Current, having a jet profile directed parallel
to the shoreline. The transversal profile of the Agulhas Current velocity distribution is not changed much along its entire length from the Mozambique
and South Madagascar current confluence at latitude 30 degrees south (see
Fig. 5.28). A typical horizontal profile of the current velocity distribution in
the transversal direction (Schuman, 1976) is shown in Fig. 5.31. The Ox axis
of the coordinate system is chosen along the current velocity direction, and
the Oy axis is in the perpendicular direction.
The transverse profile of the current velocity V = {Vx (y), 0} in this area
can be quite accurately approximated by the relation:
(5.101)
where b1 = 2.2 ms- 1 ; b2 = 6.25 X 10- 10 m- 2 at y < 0; b2 10-S m- 2 at
y > 0.
The current velocity distribution (5.101) is assumed to be valid at x < 0
in the chosen coordinate system. The point { x = 0, y = 0} is assumed to
correspond to the current velocity midstream at the point with coordinates
{27°E, 34°S}.
The Agulhas Current diverges in a fan-shaped manner at more southern
latitudes, becoming weaker.
In accordance with the Atlas (1977), it can be assumed that in the case
x > 0, the horizontal current velocity components V = {Vx (x, y), Vy (x, y)},
satisfying the continuity equation, are approximated by the equations:
(5.102)
where b3 = 0.6 X 10-ll m- 2 .
5 Wave Evolution in Non-uniform Currents in Deep Water
-180
Fig. 5.31. Horizontal current velocity distribution in transversal direction. 1 -
velocity values according to Schuman (1976); 2- approximation (5.101)
The sharp depth variation at the continental shelf margin results in the
maximum values of the Agulhas Current, having a jet profile directed parallel
to the shoreline. The transversal profile of the Agulhas Current velocity distribution is not changed much along its entire length from the Mozambique
and South Madagascar current confluence at latitude 30 degrees south (see
Fig. 5.28). A typical horizontal profile of the current velocity distribution in
the transversal direction (Schuman, 1976) is shown in Fig. 5.31. The Ox axis
of the coordinate system is chosen along the current velocity direction, and
the Oy axis is in the perpendicular direction.
The transverse profile of the current velocity V = {Vx (y), 0} in this area
can be quite accurately approximated by the relation:
(5.101)
where b1 = 2.2 ms- 1 ; b2 = 6.25 X 10- 10 m- 2 at y < 0; b2 10-S m- 2 at
y > 0.
The current velocity distribution (5.101) is assumed to be valid at x < 0
in the chosen coordinate system. The point { x = 0, y = 0} is assumed to
correspond to the current velocity midstream at the point with coordinates
{27°E, 34°S}.
The Agulhas Current diverges in a fan-shaped manner at more southern
latitudes, becoming weaker.
In accordance with the Atlas (1977), it can be assumed that in the case
x > 0, the horizontal current velocity components V = {Vx (x, y), Vy (x, y)},
satisfying the continuity equation, are approximated by the equations:
(5.102)
where b3 = 0.6 X 10-ll m- 2 .