

148
4 Physical Mechanisms Forming the Wave Spectrum in Deep Water
density values. It is evident that the dependence between the spectral density and the non-linear energy transfer function is significantly non-linear.
The spectrum variation not only significantly influences the non-linear energy transfer maximum, but also results in changes of the non-linear transfer
function in general as well. The magnitudes of the non-linear energy transfer
and also the specific frequencies where the non-linear energy transfer reveals
itself in maximum, minimum or zero change depend on ,:Y. The non-linear
transfer maximum is shifted to the low-frequency range for greater spectrum
peakness value.
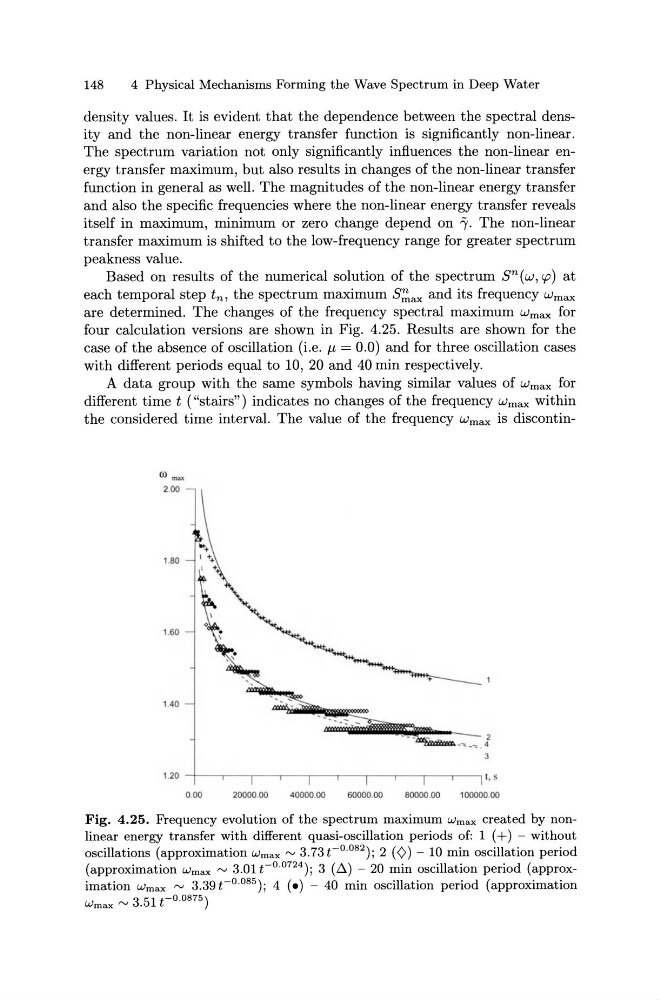
Based on results of the numerical solution of the spectrum sn(w, tp) at
each temporal step tn, the spectrum maximum s;;;ax and its frequency Wmax
are determined. The changes of the frequency spectral maximum Wmax for
four calculation versions are shown in Fig. 4.25. Results are shown for the
case of the absence of oscillation (i.e. J.L = 0.0) and for three oscillation cases
with different periods equal to 10, 20 and 40 min respectively.
A data group with the same symbols having similar values of Wmax for
different time t ( "stairs") indicates no changes of the frequency Wmax within
the considered time interval. The value of the frequency Wmax is discontinro_
2.00
1.80
1.60
1.40
0.00
20000.00
40000.00
60000.00
80000.00
100000.00
Fig. 4.25. Frequency evolution of the spectrum maximum Wmax created by nonlinear energy transfer with different quasi-oscillation periods of: 1 ( +) - without
oscillations (approximation Wmax "'3.73c 0 · 082 ) ; 2 (<)) - 10 min oscillation period
(approximation Wmax "' 3.01 t - 0 - 0724 ); 3 (~) - 20 min oscillation period (approximation Wmax "' 3.39t- 0 · 085 ) ; 4 (•) - 40 min oscillation period (approximation
Wmax rv 3.51 t- 0 . 0875 )
4 Physical Mechanisms Forming the Wave Spectrum in Deep Water
density values. It is evident that the dependence between the spectral density and the non-linear energy transfer function is significantly non-linear.
The spectrum variation not only significantly influences the non-linear energy transfer maximum, but also results in changes of the non-linear transfer
function in general as well. The magnitudes of the non-linear energy transfer
and also the specific frequencies where the non-linear energy transfer reveals
itself in maximum, minimum or zero change depend on ,:Y. The non-linear
transfer maximum is shifted to the low-frequency range for greater spectrum
peakness value.
Based on results of the numerical solution of the spectrum sn(w, tp) at
each temporal step tn, the spectrum maximum s;;;ax and its frequency Wmax
are determined. The changes of the frequency spectral maximum Wmax for
four calculation versions are shown in Fig. 4.25. Results are shown for the
case of the absence of oscillation (i.e. J.L = 0.0) and for three oscillation cases
with different periods equal to 10, 20 and 40 min respectively.
A data group with the same symbols having similar values of Wmax for
different time t ( "stairs") indicates no changes of the frequency Wmax within
the considered time interval. The value of the frequency Wmax is discontinro_
2.00
1.80
1.60
1.40
0.00
20000.00
40000.00
60000.00
80000.00
100000.00
Fig. 4.25. Frequency evolution of the spectrum maximum Wmax created by nonlinear energy transfer with different quasi-oscillation periods of: 1 ( +) - without
oscillations (approximation Wmax "'3.73c 0 · 082 ) ; 2 (<)) - 10 min oscillation period
(approximation Wmax "' 3.01 t - 0 - 0724 ); 3 (~) - 20 min oscillation period (approximation Wmax "' 3.39t- 0 · 085 ) ; 4 (•) - 40 min oscillation period (approximation
Wmax rv 3.51 t- 0 . 0875 )