

522
BRUCE HACKETT ET AL.
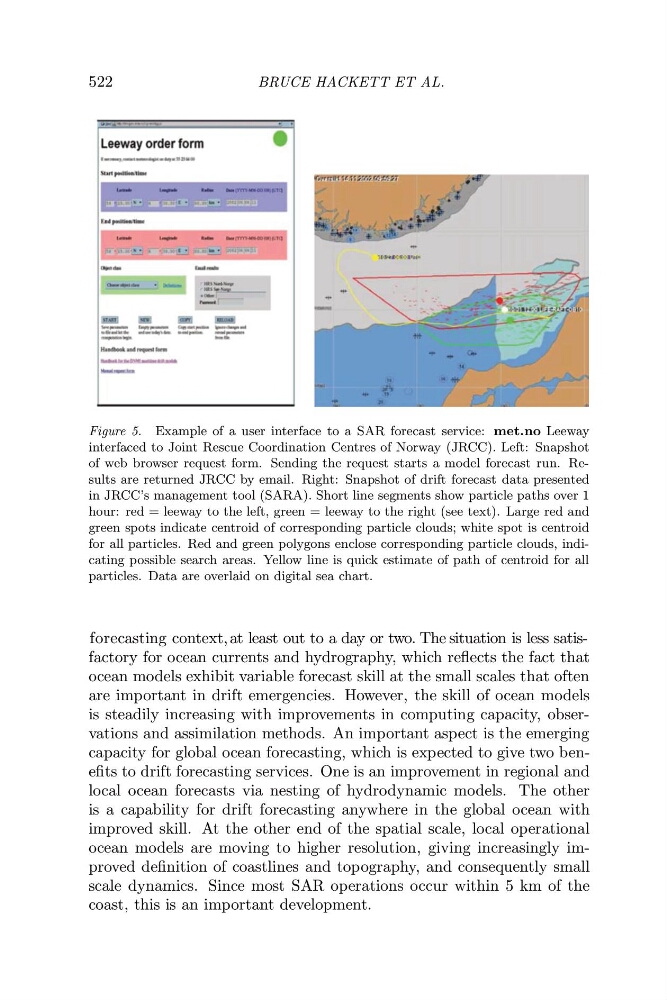
Figure 5. Example of a user interface to a SAR forecast service: met.no Leeway
interfaced to Joint Rescue Coordination Centres of Norway (JRCC). Left: Snapshot
of web browser request form. Sending the request starts a model forecast run. Results are returned JRCC by email. Right: Snapshot of drift forecast data presented
in JRCC’s management tool (SARA). Short line segments show particle paths over 1
hour: red = leeway to the left, green = leeway to the right (see text). Large red and
green spots indicate centroid of corresponding particle clouds; white spot is centroid
for all particles. Red and green polygons enclose corresponding particle clouds, indicating possible search areas. Yellow line is quick estimate of path of centroid for all
particles. Data are overlaid on digital sea chart.
factory for ocean currents and hydrography, which reflects the fact that
ocean models exhibit variable forecast skill at the small scales that often
are important in drift emergencies. However, the skill of ocean models
is steadily increasing with improvements in computing capacity, observations and assimilation methods. An important aspect is the emerging
capacity for global ocean forecasting, which is expected to give two benefits to drift forecasting services. One is an improvement in regional and
local ocean forecasts via nesting of hydrodynamic models. The other
is a capability for drift forecasting anywhere in the global ocean with
improved skill. At the other end of the spatial scale, local operational
ocean models are moving to higher resolution, giving increasingly improved definition of coastlines and topography, and consequently small
scale dynamics. Since most SAR operations occur within 5 km of the
coast, this is an important development.
forecasting context, at least out to a day or two. The situation is less satis-
BRUCE HACKETT ET AL.
Figure 5. Example of a user interface to a SAR forecast service: met.no Leeway
interfaced to Joint Rescue Coordination Centres of Norway (JRCC). Left: Snapshot
of web browser request form. Sending the request starts a model forecast run. Results are returned JRCC by email. Right: Snapshot of drift forecast data presented
in JRCC’s management tool (SARA). Short line segments show particle paths over 1
hour: red = leeway to the left, green = leeway to the right (see text). Large red and
green spots indicate centroid of corresponding particle clouds; white spot is centroid
for all particles. Red and green polygons enclose corresponding particle clouds, indicating possible search areas. Yellow line is quick estimate of path of centroid for all
particles. Data are overlaid on digital sea chart.
factory for ocean currents and hydrography, which reflects the fact that
ocean models exhibit variable forecast skill at the small scales that often
are important in drift emergencies. However, the skill of ocean models
is steadily increasing with improvements in computing capacity, observations and assimilation methods. An important aspect is the emerging
capacity for global ocean forecasting, which is expected to give two benefits to drift forecasting services. One is an improvement in regional and
local ocean forecasts via nesting of hydrodynamic models. The other
is a capability for drift forecasting anywhere in the global ocean with
improved skill. At the other end of the spatial scale, local operational
ocean models are moving to higher resolution, giving increasingly improved definition of coastlines and topography, and consequently small
scale dynamics. Since most SAR operations occur within 5 km of the
coast, this is an important development.
forecasting context, at least out to a day or two. The situation is less satis-