

US NAVY OPERATIONAL OCEANOGRAPHY
479
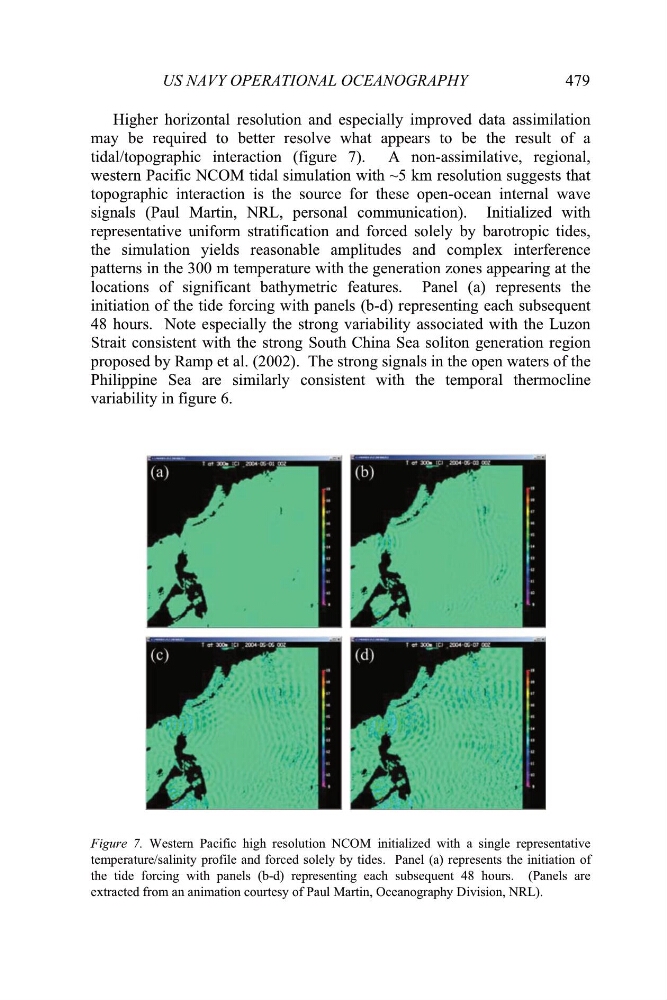
Higher horizontal resolution and especially improved data assimilation
may be required to better resolve what appears to be the result of a
tidal/topographic interaction (figure 7). A non-assimilative, regional,
western Pacific NCOM tidal simulation with ~5 km resolution suggests that
topographic interaction is the source for these open-ocean internal wave
signals (Paul Martin, NRL, personal communication). Initialized with
representative uniform stratification and forced solely by barotropic tides,
the simulation yields reasonable amplitudes and complex interference
patterns in the 300 m temperature with the generation zones appearing at the
locations of significant bathymetric features. Panel (a) represents the
initiation of the tide forcing with panels (b-d) representing each subsequent
48 hours. Note especially the strong variability associated with the Luzon
Strait consistent with the strong South China Sea soliton generation region
proposed by Ramp et al. (2002). The strong signals in the open waters of the
Philippine Sea are similarly consistent with the temporal thermocline
variability in figure 6.
Figure 7. Western Pacific high resolution NCOM initialized with a single representative
temperature/salinity profile and forced solely by tides. Panel (a) represents the initiation of
the tide forcing with panels (b-d) representing each subsequent 48 hours. (Panels are
extracted from an animation courtesy of Paul Martin, Oceanography Division, NRL).
479
Higher horizontal resolution and especially improved data assimilation
may be required to better resolve what appears to be the result of a
tidal/topographic interaction (figure 7). A non-assimilative, regional,
western Pacific NCOM tidal simulation with ~5 km resolution suggests that
topographic interaction is the source for these open-ocean internal wave
signals (Paul Martin, NRL, personal communication). Initialized with
representative uniform stratification and forced solely by barotropic tides,
the simulation yields reasonable amplitudes and complex interference
patterns in the 300 m temperature with the generation zones appearing at the
locations of significant bathymetric features. Panel (a) represents the
initiation of the tide forcing with panels (b-d) representing each subsequent
48 hours. Note especially the strong variability associated with the Luzon
Strait consistent with the strong South China Sea soliton generation region
proposed by Ramp et al. (2002). The strong signals in the open waters of the
Philippine Sea are similarly consistent with the temporal thermocline
variability in figure 6.
Figure 7. Western Pacific high resolution NCOM initialized with a single representative
temperature/salinity profile and forced solely by tides. Panel (a) represents the initiation of
the tide forcing with panels (b-d) representing each subsequent 48 hours. (Panels are
extracted from an animation courtesy of Paul Martin, Oceanography Division, NRL).