

432
ANDREAS SCHILLER AND NEVILLE SMITH
bathymetry and island barriers which resolves both the large-scale structure
as well as narrow boundary features.
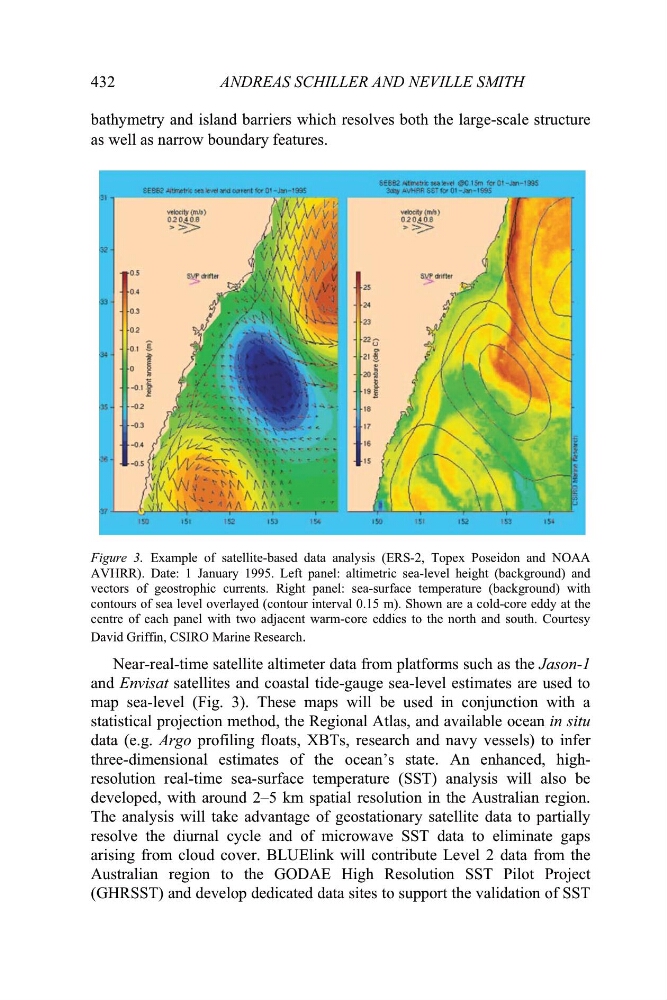
Figure 3. Example of satellite-based data analysis (ERS-2, Topex Poseidon and NOAA
AVHRR). Date: 1 January 1995. Left panel: altimetric sea-level height (background) and
vectors of geostrophic currents. Right panel: sea-surface temperature (background) with
contours of sea level overlayed (contour interval 0.15 m). Shown are a cold-core eddy at the
centre of each panel with two adjacent warm-core eddies to the north and south. Courtesy
David Griffin, CSIRO Marine Research.
Near-real-time satellite altimeter data from platforms such as the Jason-1
and Envisat satellites and coastal tide-gauge sea-level estimates are used to
map sea-level (Fig. 3). These maps will be used in conjunction with a
statistical projection method, the Regional Atlas, and available ocean in situ
data (e.g. Argo profiling floats, XBTs, research and navy vessels) to infer
three-dimensional estimates of the ocean’s state. An enhanced, highresolution real-time sea-surface temperature (SST) analysis will also be
developed, with around 2–5 km spatial resolution in the Australian region.
The analysis will take advantage of geostationary satellite data to partially
resolve the diurnal cycle and of microwave SST data to eliminate gaps
arising from cloud cover. BLUElink will contribute Level 2 data from the
Australian region to the GODAE High Resolution SST Pilot Project
(GHRSST) and develop dedicated data sites to support the validation of SST
ANDREAS SCHILLER AND NEVILLE SMITH
bathymetry and island barriers which resolves both the large-scale structure
as well as narrow boundary features.
Figure 3. Example of satellite-based data analysis (ERS-2, Topex Poseidon and NOAA
AVHRR). Date: 1 January 1995. Left panel: altimetric sea-level height (background) and
vectors of geostrophic currents. Right panel: sea-surface temperature (background) with
contours of sea level overlayed (contour interval 0.15 m). Shown are a cold-core eddy at the
centre of each panel with two adjacent warm-core eddies to the north and south. Courtesy
David Griffin, CSIRO Marine Research.
Near-real-time satellite altimeter data from platforms such as the Jason-1
and Envisat satellites and coastal tide-gauge sea-level estimates are used to
map sea-level (Fig. 3). These maps will be used in conjunction with a
statistical projection method, the Regional Atlas, and available ocean in situ
data (e.g. Argo profiling floats, XBTs, research and navy vessels) to infer
three-dimensional estimates of the ocean’s state. An enhanced, highresolution real-time sea-surface temperature (SST) analysis will also be
developed, with around 2–5 km spatial resolution in the Australian region.
The analysis will take advantage of geostationary satellite data to partially
resolve the diurnal cycle and of microwave SST data to eliminate gaps
arising from cloud cover. BLUElink will contribute Level 2 data from the
Australian region to the GODAE High Resolution SST Pilot Project
(GHRSST) and develop dedicated data sites to support the validation of SST