

390
PIERRE BAHUREL
through the Armor tool (data 3D optimal interpolation tool for global ocean)
to detect any strong anomalies in the data sets (combination and crosscorrelation). Model outputs are compared to independent in situ data set
where available, and simple scores (e.g. Analysis / Forecast comparison) are
computed. The systematic comparisons with in situ observations, as
illustrated on Figure 2, are weekly computed and are available on the
MERCATOR Web site, as well as internal diagnostics of assimilation.
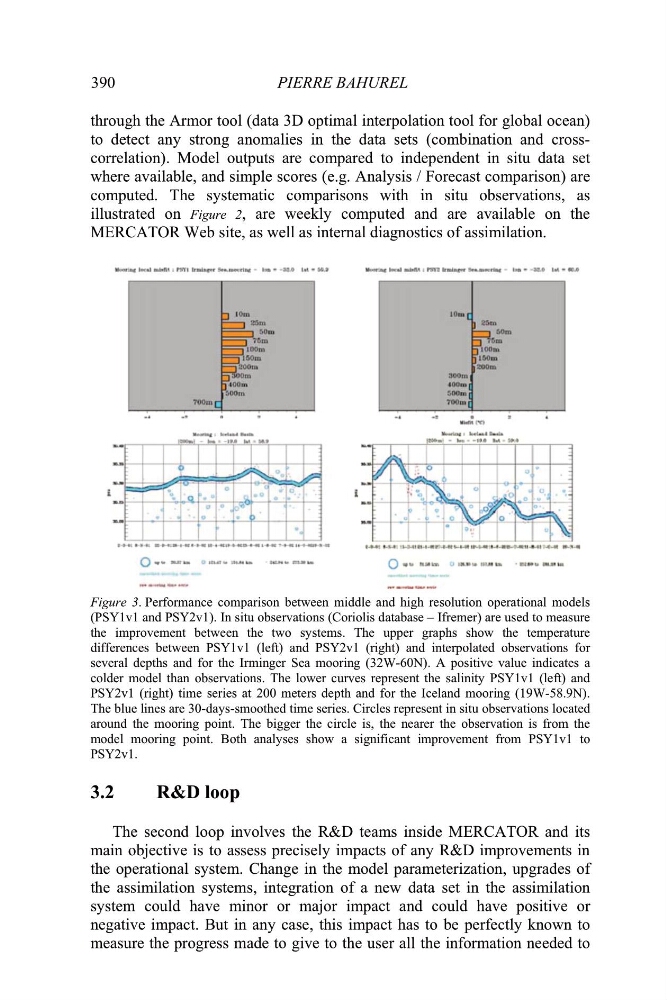
Figure 3. Performance comparison between middle and high resolution operational models
(PSY1v1 and PSY2v1). In situ observations (Coriolis database – Ifremer) are used to measure
the improvement between the two systems. The upper graphs show the temperature
differences between PSY1v1 (left) and PSY2v1 (right) and interpolated observations for
several depths and for the Irminger Sea mooring (32W-60N). A positive value indicates a
colder model than observations. The lower curves represent the salinity PSY1v1 (left) and
PSY2v1 (right) time series at 200 meters depth and for the Iceland mooring (19W-58.9N).
The blue lines are 30-days-smoothed time series. Circles represent in situ observations located
around the mooring point. The bigger the circle is, the nearer the observation is from the
model mooring point. Both analyses show a significant improvement from PSY1v1 to
PSY2v1.
3.2
R&D loop
The second loop involves the R&D teams inside MERCATOR and its
main objective is to assess precisely impacts of any R&D improvements in
the operational system. Change in the model parameterization, upgrades of
the assimilation systems, integration of a new data set in the assimilation
system could have minor or major impact and could have positive or
negative impact. But in any case, this impact has to be perfectly known to
measure the progress made to give to the user all the information needed to
PIERRE BAHUREL
through the Armor tool (data 3D optimal interpolation tool for global ocean)
to detect any strong anomalies in the data sets (combination and crosscorrelation). Model outputs are compared to independent in situ data set
where available, and simple scores (e.g. Analysis / Forecast comparison) are
computed. The systematic comparisons with in situ observations, as
illustrated on Figure 2, are weekly computed and are available on the
MERCATOR Web site, as well as internal diagnostics of assimilation.
Figure 3. Performance comparison between middle and high resolution operational models
(PSY1v1 and PSY2v1). In situ observations (Coriolis database – Ifremer) are used to measure
the improvement between the two systems. The upper graphs show the temperature
differences between PSY1v1 (left) and PSY2v1 (right) and interpolated observations for
several depths and for the Irminger Sea mooring (32W-60N). A positive value indicates a
colder model than observations. The lower curves represent the salinity PSY1v1 (left) and
PSY2v1 (right) time series at 200 meters depth and for the Iceland mooring (19W-58.9N).
The blue lines are 30-days-smoothed time series. Circles represent in situ observations located
around the mooring point. The bigger the circle is, the nearer the observation is from the
model mooring point. Both analyses show a significant improvement from PSY1v1 to
PSY2v1.
3.2
R&D loop
The second loop involves the R&D teams inside MERCATOR and its
main objective is to assess precisely impacts of any R&D improvements in
the operational system. Change in the model parameterization, upgrades of
the assimilation systems, integration of a new data set in the assimilation
system could have minor or major impact and could have positive or
negative impact. But in any case, this impact has to be perfectly known to
measure the progress made to give to the user all the information needed to