

346
FLORENCE RABIER
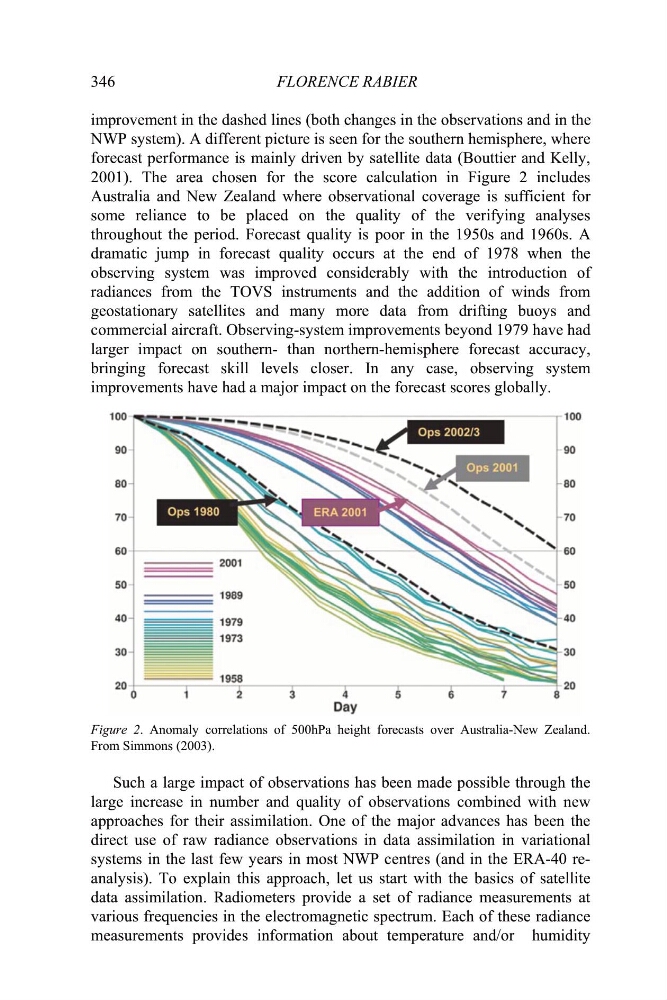
improvement in the dashed lines (both changes in the observations and in the
NWP system). A different picture is seen for the southern hemisphere, where
forecast performance is mainly driven by satellite data (Bouttier and Kelly,
2001). The area chosen for the score calculation in Figure 2 includes
Australia and New Zealand where observational coverage is sufficient for
some reliance to be placed on the quality of the verifying analyses
throughout the period. Forecast quality is poor in the 1950s and 1960s. A
dramatic jump in forecast quality occurs at the end of 1978 when the
observing system was improved considerably with the introduction of
radiances from the TOVS instruments and the addition of winds from
geostationary satellites and many more data from drifting buoys and
commercial aircraft. Observing-system improvements beyond 1979 have had
larger impact on southern- than northern-hemisphere forecast accuracy,
bringing forecast skill levels closer. In any case, observing system
improvements have had a major impact on the forecast scores globally.
Figure 2. Anomaly correlations of 500hPa height forecasts over Australia-New Zealand.
From Simmons (2003).
Such a large impact of observations has been made possible through the
large increase in number and quality of observations combined with new
approaches for their assimilation. One of the major advances has been the
direct use of raw radiance observations in data assimilation in variational
systems in the last few years in most NWP centres (and in the ERA-40 reanalysis). To explain this approach, let us start with the basics of satellite
data assimilation. Radiometers provide a set of radiance measurements at
various frequencies in the electromagnetic spectrum. Each of these radiance
measurements provides information about temperature and/or humidity
FLORENCE RABIER
improvement in the dashed lines (both changes in the observations and in the
NWP system). A different picture is seen for the southern hemisphere, where
forecast performance is mainly driven by satellite data (Bouttier and Kelly,
2001). The area chosen for the score calculation in Figure 2 includes
Australia and New Zealand where observational coverage is sufficient for
some reliance to be placed on the quality of the verifying analyses
throughout the period. Forecast quality is poor in the 1950s and 1960s. A
dramatic jump in forecast quality occurs at the end of 1978 when the
observing system was improved considerably with the introduction of
radiances from the TOVS instruments and the addition of winds from
geostationary satellites and many more data from drifting buoys and
commercial aircraft. Observing-system improvements beyond 1979 have had
larger impact on southern- than northern-hemisphere forecast accuracy,
bringing forecast skill levels closer. In any case, observing system
improvements have had a major impact on the forecast scores globally.
Figure 2. Anomaly correlations of 500hPa height forecasts over Australia-New Zealand.
From Simmons (2003).
Such a large impact of observations has been made possible through the
large increase in number and quality of observations combined with new
approaches for their assimilation. One of the major advances has been the
direct use of raw radiance observations in data assimilation in variational
systems in the last few years in most NWP centres (and in the ERA-40 reanalysis). To explain this approach, let us start with the basics of satellite
data assimilation. Radiometers provide a set of radiance measurements at
various frequencies in the electromagnetic spectrum. Each of these radiance
measurements provides information about temperature and/or humidity