

METEOROLOGICAL DATA PERSPECTIVE
345
Simmons (2003), a re-analysis was conducted from September 1957 to
August 2002 based on cycle 23r4 of ECMWF forecasting system operational
from June 2001 to January 2002. It uses six-hourly variational analysis, a
degraded version of the operational analysis scheme. The T159 horizontal
resolution (~125km grid) is coarser than current operations which uses T511
(~39km grid). This re-analysis can then be seen as a cheaper version of the
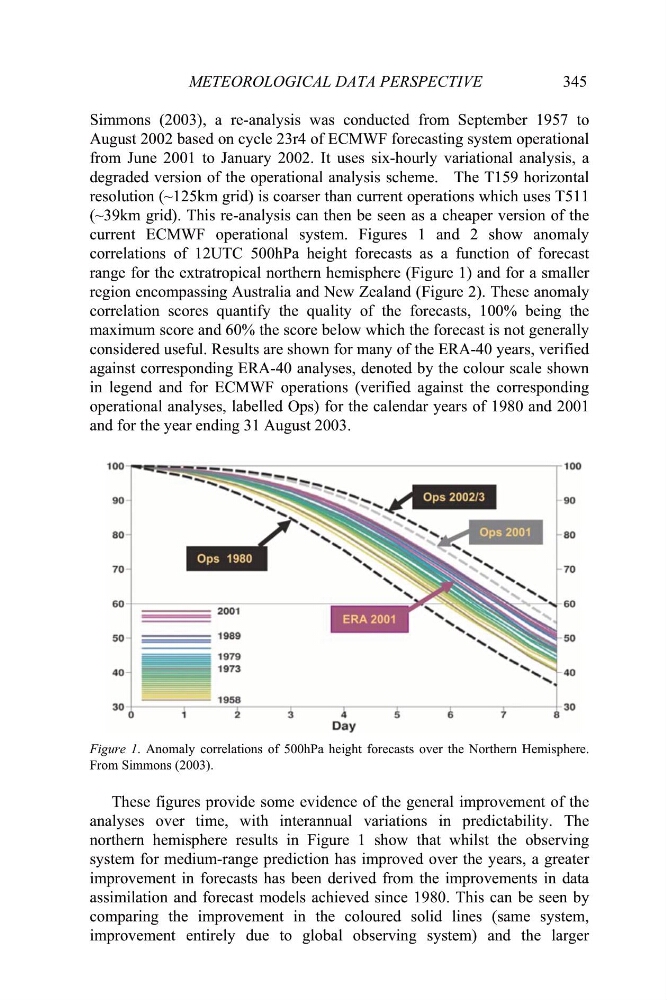
current ECMWF operational system. Figures 1 and 2 show anomaly
correlations of 12UTC 500hPa height forecasts as a function of forecast
range for the extratropical northern hemisphere (Figure 1) and for a smaller
region encompassing Australia and New Zealand (Figure 2). These anomaly
correlation scores quantify the quality of the forecasts, 100% being the
maximum score and 60% the score below which the forecast is not generally
considered useful. Results are shown for many of the ERA-40 years, verified
against corresponding ERA-40 analyses, denoted by the colour scale shown
in legend and for ECMWF operations (verified against the corresponding
operational analyses, labelled Ops) for the calendar years of 1980 and 2001
and for the year ending 31 August 2003.
Figure 1. Anomaly correlations of 500hPa height forecasts over the Northern Hemisphere.
From Simmons (2003).
These figures provide some evidence of the general improvement of the
analyses over time, with interannual variations in predictability. The
northern hemisphere results in Figure 1 show that whilst the observing
system for medium-range prediction has improved over the years, a greater
improvement in forecasts has been derived from the improvements in data
assimilation and forecast models achieved since 1980. This can be seen by
comparing the improvement in the coloured solid lines (same system,
improvement entirely due to global observing system) and the larger
345
Simmons (2003), a re-analysis was conducted from September 1957 to
August 2002 based on cycle 23r4 of ECMWF forecasting system operational
from June 2001 to January 2002. It uses six-hourly variational analysis, a
degraded version of the operational analysis scheme. The T159 horizontal
resolution (~125km grid) is coarser than current operations which uses T511
(~39km grid). This re-analysis can then be seen as a cheaper version of the
current ECMWF operational system. Figures 1 and 2 show anomaly
correlations of 12UTC 500hPa height forecasts as a function of forecast
range for the extratropical northern hemisphere (Figure 1) and for a smaller
region encompassing Australia and New Zealand (Figure 2). These anomaly
correlation scores quantify the quality of the forecasts, 100% being the
maximum score and 60% the score below which the forecast is not generally
considered useful. Results are shown for many of the ERA-40 years, verified
against corresponding ERA-40 analyses, denoted by the colour scale shown
in legend and for ECMWF operations (verified against the corresponding
operational analyses, labelled Ops) for the calendar years of 1980 and 2001
and for the year ending 31 August 2003.
Figure 1. Anomaly correlations of 500hPa height forecasts over the Northern Hemisphere.
From Simmons (2003).
These figures provide some evidence of the general improvement of the
analyses over time, with interannual variations in predictability. The
northern hemisphere results in Figure 1 show that whilst the observing
system for medium-range prediction has improved over the years, a greater
improvement in forecasts has been derived from the improvements in data
assimilation and forecast models achieved since 1980. This can be seen by
comparing the improvement in the coloured solid lines (same system,
improvement entirely due to global observing system) and the larger