

264
WILLIAM B. LARGE
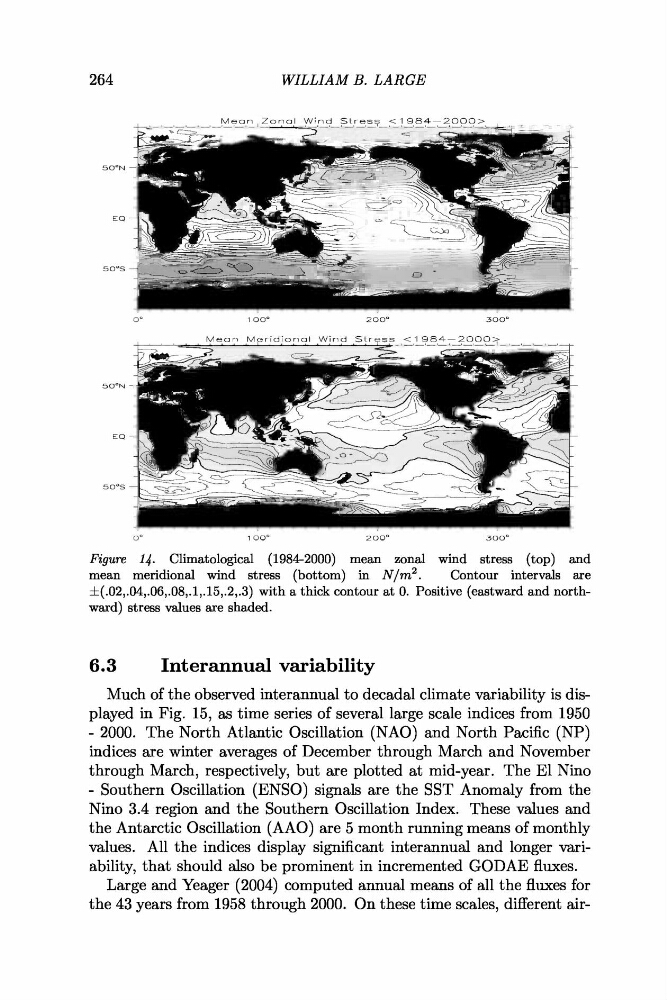
Figure 14. Climatological (1984-2000) mean zonal wind stress (top) and
mean meridional wind stress (bottom) in ~ / r n ~ . Contour intervals are
f (.02,.04,.06,.08,.1,.15,.2,.3) with a thick contour at 0. Positive (eastward and northward) stress values are shaded.
6.3
Interannual variability
Much of the observed interannual to decadal climate variability is displayed in Fig. 15, as time series of several large scale indices from 1950
- 2000. The North Atlantic Oscillation (NAO) and North Pacific (NP)
indices are winter averages of December through March and November
through March, respectively, but are plotted at mid-year. The El Nino
- Southern Oscillation (ENSO) signals are the SST Anomaly from the
Nino 3.4 region and the Southern Oscillation Index. These values and
the Antarctic Oscillation (AAO) are 5 month running means of monthly
values. All the indices display significant interannual and longer variability, that should also be prominent in incremented GODAE fluxes.
Large and Yeager (2004) computed annual means of all the fluxes for
the 43 years from 1958 through 2000. On these time scales, different air-
WILLIAM B. LARGE
Figure 14. Climatological (1984-2000) mean zonal wind stress (top) and
mean meridional wind stress (bottom) in ~ / r n ~ . Contour intervals are
f (.02,.04,.06,.08,.1,.15,.2,.3) with a thick contour at 0. Positive (eastward and northward) stress values are shaded.
6.3
Interannual variability
Much of the observed interannual to decadal climate variability is displayed in Fig. 15, as time series of several large scale indices from 1950
- 2000. The North Atlantic Oscillation (NAO) and North Pacific (NP)
indices are winter averages of December through March and November
through March, respectively, but are plotted at mid-year. The El Nino
- Southern Oscillation (ENSO) signals are the SST Anomaly from the
Nino 3.4 region and the Southern Oscillation Index. These values and
the Antarctic Oscillation (AAO) are 5 month running means of monthly
values. All the indices display significant interannual and longer variability, that should also be prominent in incremented GODAE fluxes.
Large and Yeager (2004) computed annual means of all the fluxes for
the 43 years from 1958 through 2000. On these time scales, different air-