

SURFACE FL UXES
263
I
I
I
I
I
I
I
I
I
I
I
I
I
I
I
I
I
I
I
I
I
I
I
I
I
I
I
I
I
I
I
I
I
I
I
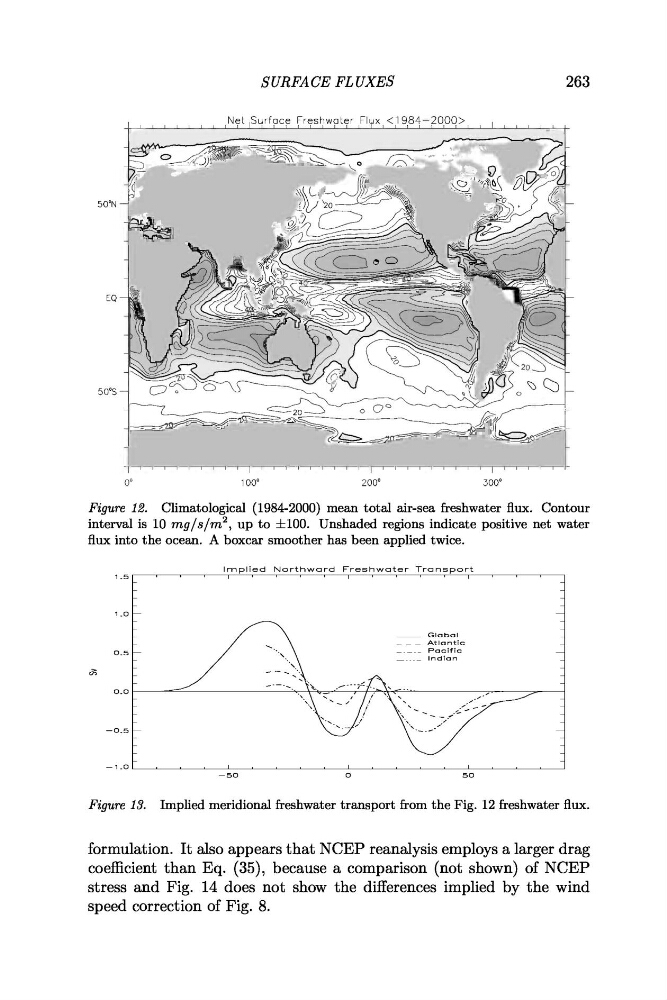
Net lSurface Freshwater Flyx < 1 9 8 4 - 2 0 0 0 >
Figure 12. Climatological (1984-2000) mean total air-sea freshwater flux. Contour
interval is 10 mg/s/m2, up to f 100. Unshaded regions indicate positive net water
flux into the ocean. A boxcar smoother has been applied twice.
Figure 13. Implied meridional freshwater transport from the Fig. 12 freshwater flux.
I m p l i e d N o r t h w a r d Freshwater T r a n s p o r t
formulation. It also appears that NCEP reanalysis employs a larger drag
coefficient than Eq. (35), because a comparison (not shown) of NCEP
stress and Fig. 14 does not show the differences implied by the wind
speed correction of Fig. 8.
1.5
1.0
I
I
I
I
I
I
I
I
I
I
I
-
-
Global
Atlantic
0.5 -
Pacific
-
Indian
>
c
,
,
0.0
-0.5 -
-
263
I
I
I
I
I
I
I
I
I
I
I
I
I
I
I
I
I
I
I
I
I
I
I
I
I
I
I
I
I
I
I
I
I
I
I
Net lSurface Freshwater Flyx < 1 9 8 4 - 2 0 0 0 >
Figure 12. Climatological (1984-2000) mean total air-sea freshwater flux. Contour
interval is 10 mg/s/m2, up to f 100. Unshaded regions indicate positive net water
flux into the ocean. A boxcar smoother has been applied twice.
Figure 13. Implied meridional freshwater transport from the Fig. 12 freshwater flux.
I m p l i e d N o r t h w a r d Freshwater T r a n s p o r t
formulation. It also appears that NCEP reanalysis employs a larger drag
coefficient than Eq. (35), because a comparison (not shown) of NCEP
stress and Fig. 14 does not show the differences implied by the wind
speed correction of Fig. 8.
1.5
1.0
I
I
I
I
I
I
I
I
I
I
I
-
-
Global
Atlantic
0.5 -
Pacific
-
Indian
>
c
,
,
0.0
-0.5 -
-