

260
WILLIAM B. LARGE
Shortwave radiation is greatest at latitudes where there is a lot of
ocean. Therefore, small tropical and sub-tropical errors in this field can
significantly impact the global heat balance. Comparisons of Qs such
as Fig. 6, and the need to achieve a better global heat balance suggest
reducing QI from ISCCP-FP by 5% for all latitudes from 50"s to 30°N.
For smoothness, the correction is linearly diminished between 50"s and
60"s and between 30°N and 40°N. The resulting net shortwave, Qs, is
shown by the thick solid curve in Fig. 7. The global mean is reduced by
8 w / m 2 (Table 3).
With the above wind and humidity corrections and uncorrected GXGXS
precipitation, the global ocean freshwater budget (4) is about -5 mg/m2/s.
To better balance the global oceanic water budget, both a gain (1.1417)
and bias (0.7 mg/m2/s) are applied to the GXGXS precipitation fields.
The global mean freshwater flux then becomes -0.1 mg/m2/s (Table 3).
This correction is designed to shift the GPCP curve of Fig. 8 into agreement with SOC and MSU at the 7" N peak in precipitation. By chance,
the improved SOC agreement holds equatorward of about 35". However,
farther poleward the corrected precipitation becomes higher than SOC,
but is still less than GPCP in both hemispheres, as favored by ocean
model salinity results.
I , , , , , , , , , y e t Air-Sea Heat Flu? 1<1,984;?090? , , , I , , , , , ,
I
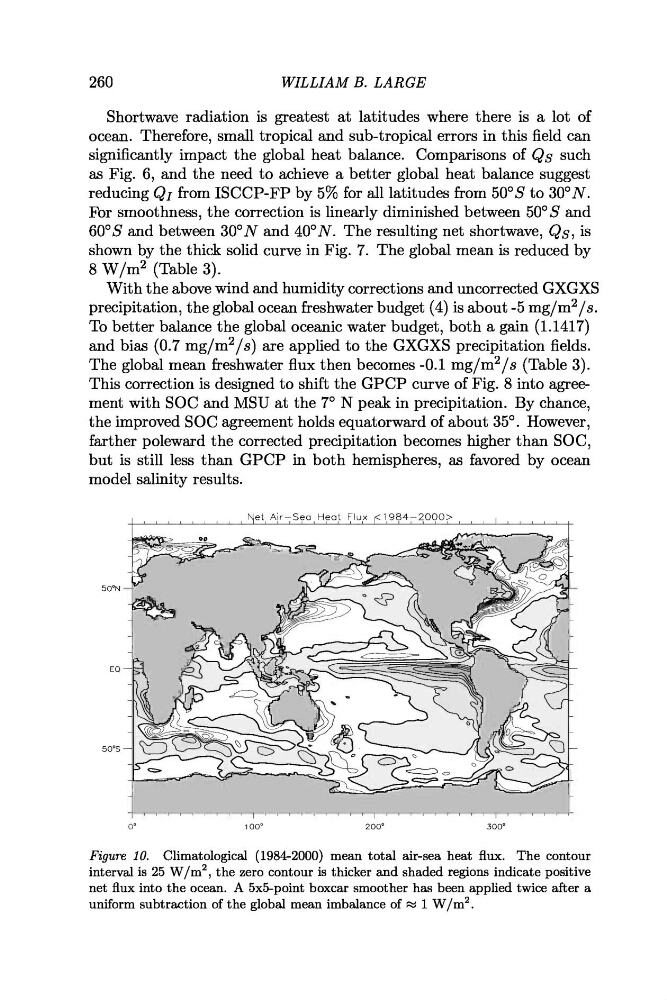
Figure 10. Climatological (1984-2000) mean total air-sea heat flux. The contour
interval is 25 w/m2, the zero contour is thicker and shaded regions indicate positive
net flux into the ocean. A 5x5-point boxcar smoother has been applied twice after a
uniform subtraction of the global mean imbalance of x 1 w/m2.
WILLIAM B. LARGE
Shortwave radiation is greatest at latitudes where there is a lot of
ocean. Therefore, small tropical and sub-tropical errors in this field can
significantly impact the global heat balance. Comparisons of Qs such
as Fig. 6, and the need to achieve a better global heat balance suggest
reducing QI from ISCCP-FP by 5% for all latitudes from 50"s to 30°N.
For smoothness, the correction is linearly diminished between 50"s and
60"s and between 30°N and 40°N. The resulting net shortwave, Qs, is
shown by the thick solid curve in Fig. 7. The global mean is reduced by
8 w / m 2 (Table 3).
With the above wind and humidity corrections and uncorrected GXGXS
precipitation, the global ocean freshwater budget (4) is about -5 mg/m2/s.
To better balance the global oceanic water budget, both a gain (1.1417)
and bias (0.7 mg/m2/s) are applied to the GXGXS precipitation fields.
The global mean freshwater flux then becomes -0.1 mg/m2/s (Table 3).
This correction is designed to shift the GPCP curve of Fig. 8 into agreement with SOC and MSU at the 7" N peak in precipitation. By chance,
the improved SOC agreement holds equatorward of about 35". However,
farther poleward the corrected precipitation becomes higher than SOC,
but is still less than GPCP in both hemispheres, as favored by ocean
model salinity results.
I , , , , , , , , , y e t Air-Sea Heat Flu? 1<1,984;?090? , , , I , , , , , ,
I
Figure 10. Climatological (1984-2000) mean total air-sea heat flux. The contour
interval is 25 w/m2, the zero contour is thicker and shaded regions indicate positive
net flux into the ocean. A 5x5-point boxcar smoother has been applied twice after a
uniform subtraction of the global mean imbalance of x 1 w/m2.