

258
WILLIAM B. LARGE
Chin et al. (1998). Figure 8 shows the ratio of the two year mean
QSCAT speed to that from NCEP. A low bias is evident in the NCEP
winds, with this ratio greater than 1 everywhere except a few isolated
(unshaded) regions off the coasts of South America and Africa. The
QSCAT winds are between 5 and 10% higher than NCEP winds over
most of the mid-latitude ocean, and the ratio is considerably higher in
select regions near the equator and the poles. To correct the NCEP
wind speed bias, both reanalysis vector wind components are multiplied
by the spatially-dependent factor plotted in Fig. 8. An important effect is to make the evaporation and turbulent heat fluxes more negative,
thereby improving the global heat balance by 8 W/m 2 , and the freshwater balance by 2.9 mg/m 2 /s (Table 3).
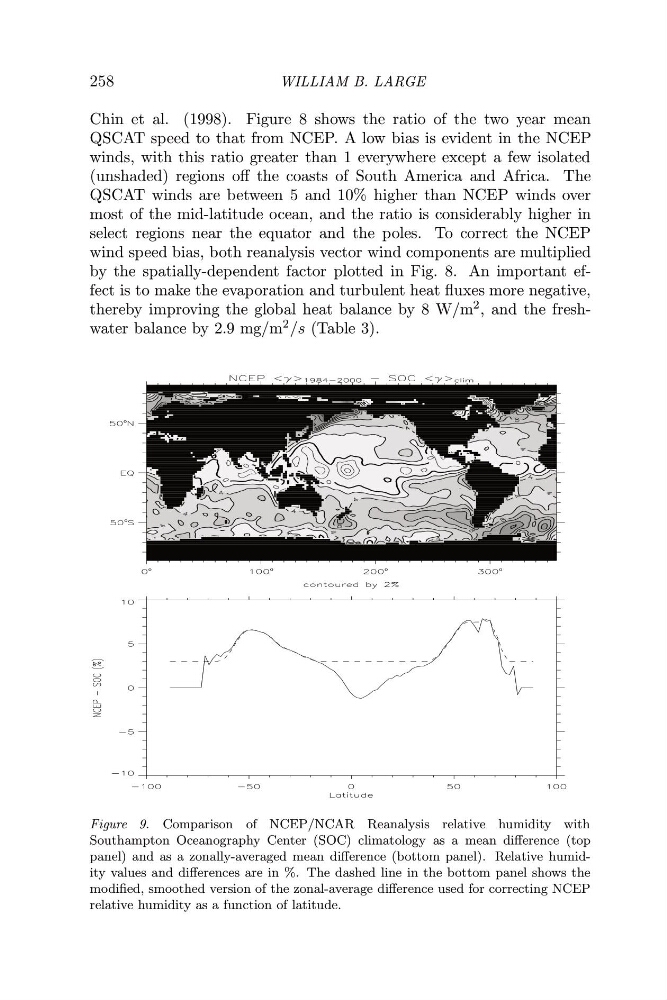
Figure 9. Comparison of NCEP/NCAR Reanalysis relative humidity with
Southampton Oceanography Center (SOC) climatology as a mean difference (top
panel) and as a zonally-averaged mean difference (bottom panel). Relative humidity values and differences are in %. The dashed line in the bottom panel shows the
modified, smoothed version of the zonal-average difference used for correcting NCEP
relative humidity as a function of latitude.
WILLIAM B. LARGE
Chin et al. (1998). Figure 8 shows the ratio of the two year mean
QSCAT speed to that from NCEP. A low bias is evident in the NCEP
winds, with this ratio greater than 1 everywhere except a few isolated
(unshaded) regions off the coasts of South America and Africa. The
QSCAT winds are between 5 and 10% higher than NCEP winds over
most of the mid-latitude ocean, and the ratio is considerably higher in
select regions near the equator and the poles. To correct the NCEP
wind speed bias, both reanalysis vector wind components are multiplied
by the spatially-dependent factor plotted in Fig. 8. An important effect is to make the evaporation and turbulent heat fluxes more negative,
thereby improving the global heat balance by 8 W/m 2 , and the freshwater balance by 2.9 mg/m 2 /s (Table 3).
Figure 9. Comparison of NCEP/NCAR Reanalysis relative humidity with
Southampton Oceanography Center (SOC) climatology as a mean difference (top
panel) and as a zonally-averaged mean difference (bottom panel). Relative humidity values and differences are in %. The dashed line in the bottom panel shows the
modified, smoothed version of the zonal-average difference used for correcting NCEP
relative humidity as a function of latitude.