

SATELLITE MEASUREMENTS
165
particularly where there is riverine and coastal discharge or strong tidal
currents stirring up bottom sediments, unless in situ observations confirm
that Case 1 conditions apply.
Another useful measurement that can be derived from the ocean colour is
the optical diffuse attenuation coefficient, K, usually defined at a particular
wavelength such as 490 nm (i.e. K 490 ). This is also inversely correlated with
the blue-green ratio because the less the attenuation coefficient, the deeper
the light penetrates before it is scattered back out, the more of the longer
wavelengths are absorbed, and the bluer the water appears. The algorithms
for K are similar in form to (4) and are less sensitive to whether Case 1 or
Case 2 conditions are found.
3.2.3
Ocean colour sensors and products
Although visible wavelength radiometers were among the very first Earth
observing sensors flown in the 1970s the development of ocean colour
sensors is less mature than that of other methods of satellite oceanography.
After the Coastal Zone Color Scanner (CZCS) proved the concept of
measuring chlorophyll from space in 1978-1986, there was a long pause
until the Ocean Colour and Thermal Sensor (OCTS) was launched in 1996,
followed by the Sea-viewing Wide Field-of-view Sensor (SeaWiFS) in
1997, which has provided the first reliable, long-term fully operational
delivery of ocean colour data products. Since then two Moderate resolution
imaging spectrometers (MODIS), the Medium resolution imaging
spectrometer (MERIS) and the Global Imager (GLI) have been launched
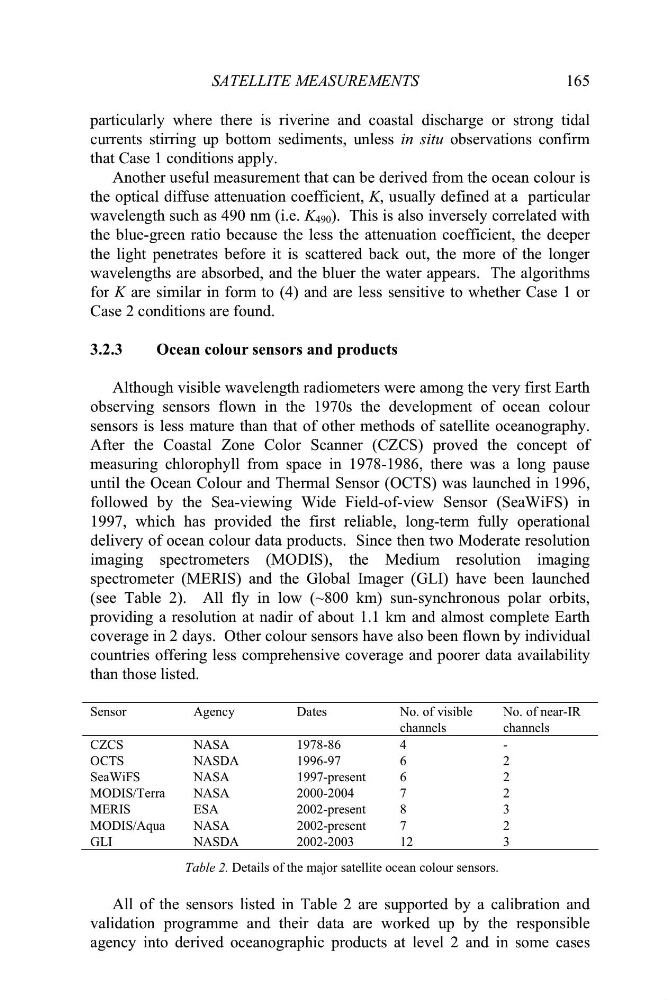
(see Table 2). All fly in low (~800 km) sun-synchronous polar orbits,
providing a resolution at nadir of about 1.1 km and almost complete Earth
coverage in 2 days. Other colour sensors have also been flown by individual
countries offering less comprehensive coverage and poorer data availability
than those listed.
Sensor
Agency
Dates
No. of visible
channels
No. of near-IR
channels
CZCS
NASA
1978-86
4
-
OCTS
NASDA
1996-97
6
2
SeaWiFS
NASA
1997-present
6
2
MODIS/Terra
NASA
2000-2004
7
2
MERIS
ESA
2002-present
8
3
MODIS/Aqua
NASA
2002-present
7
2
GLI
NASDA
2002-2003
12
3
Table 2. Details of the major satellite ocean colour sensors.
All of the sensors listed in Table 2 are supported by a calibration and
validation programme and their data are worked up by the responsible
agency into derived oceanographic products at level 2 and in some cases
165
particularly where there is riverine and coastal discharge or strong tidal
currents stirring up bottom sediments, unless in situ observations confirm
that Case 1 conditions apply.
Another useful measurement that can be derived from the ocean colour is
the optical diffuse attenuation coefficient, K, usually defined at a particular
wavelength such as 490 nm (i.e. K 490 ). This is also inversely correlated with
the blue-green ratio because the less the attenuation coefficient, the deeper
the light penetrates before it is scattered back out, the more of the longer
wavelengths are absorbed, and the bluer the water appears. The algorithms
for K are similar in form to (4) and are less sensitive to whether Case 1 or
Case 2 conditions are found.
3.2.3
Ocean colour sensors and products
Although visible wavelength radiometers were among the very first Earth
observing sensors flown in the 1970s the development of ocean colour
sensors is less mature than that of other methods of satellite oceanography.
After the Coastal Zone Color Scanner (CZCS) proved the concept of
measuring chlorophyll from space in 1978-1986, there was a long pause
until the Ocean Colour and Thermal Sensor (OCTS) was launched in 1996,
followed by the Sea-viewing Wide Field-of-view Sensor (SeaWiFS) in
1997, which has provided the first reliable, long-term fully operational
delivery of ocean colour data products. Since then two Moderate resolution
imaging spectrometers (MODIS), the Medium resolution imaging
spectrometer (MERIS) and the Global Imager (GLI) have been launched
(see Table 2). All fly in low (~800 km) sun-synchronous polar orbits,
providing a resolution at nadir of about 1.1 km and almost complete Earth
coverage in 2 days. Other colour sensors have also been flown by individual
countries offering less comprehensive coverage and poorer data availability
than those listed.
Sensor
Agency
Dates
No. of visible
channels
No. of near-IR
channels
CZCS
NASA
1978-86
4
-
OCTS
NASDA
1996-97
6
2
SeaWiFS
NASA
1997-present
6
2
MODIS/Terra
NASA
2000-2004
7
2
MERIS
ESA
2002-present
8
3
MODIS/Aqua
NASA
2002-present
7
2
GLI
NASDA
2002-2003
12
3
Table 2. Details of the major satellite ocean colour sensors.
All of the sensors listed in Table 2 are supported by a calibration and
validation programme and their data are worked up by the responsible
agency into derived oceanographic products at level 2 and in some cases