

5.12 Exercise 25: Simulation of an El-Ni˜ no Event
165
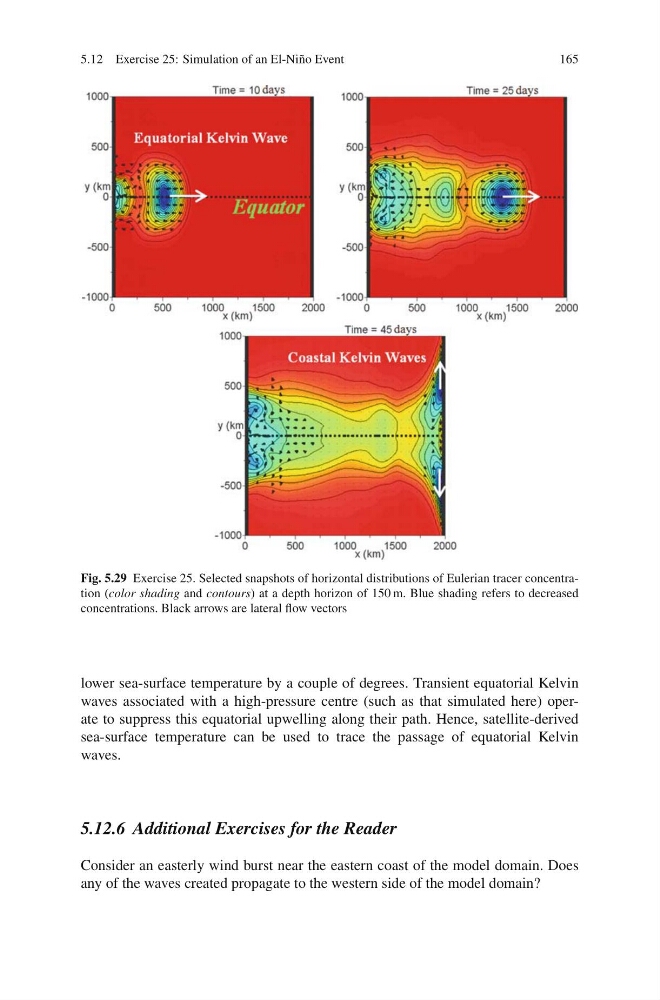
Fig. 5.29 Exercise 25. Selected snapshots of horizontal distributions of Eulerian tracer concentration (color shading and contours) at a depth horizon of 150 m. Blue shading refers to decreased
concentrations. Black arrows are lateral flow vectors
lower sea-surface temperature by a couple of degrees. Transient equatorial Kelvin
waves associated with a high-pressure centre (such as that simulated here) operate to suppress this equatorial upwelling along their path. Hence, satellite-derived
sea-surface temperature can be used to trace the passage of equatorial Kelvin
waves.
5.12.6 Additional Exercises for the Reader
Consider an easterly wind burst near the eastern coast of the model domain. Does
any of the waves created propagate to the western side of the model domain?
165
Fig. 5.29 Exercise 25. Selected snapshots of horizontal distributions of Eulerian tracer concentration (color shading and contours) at a depth horizon of 150 m. Blue shading refers to decreased
concentrations. Black arrows are lateral flow vectors
lower sea-surface temperature by a couple of degrees. Transient equatorial Kelvin
waves associated with a high-pressure centre (such as that simulated here) operate to suppress this equatorial upwelling along their path. Hence, satellite-derived
sea-surface temperature can be used to trace the passage of equatorial Kelvin
waves.
5.12.6 Additional Exercises for the Reader
Consider an easterly wind burst near the eastern coast of the model domain. Does
any of the waves created propagate to the western side of the model domain?