

116
4 2.5D Vertical Slice Modelling
to the surface. The bottom Ekman layer is the result of geostrophic alongshore flow
that runs into the same direction as the wind. This geostrophic flow is magnified in
vicinity of the surface density front, created by the upwelling, where it attains speeds
of 60 cm/s. Step-type representation of variable bathymetry obviously induces some
artificial local disturbances, but this does not lead to numerical instabilities.
Theory gives a frontal speed of c =
√
(g h 1 ) of 49 cm/s and an internal Rossby
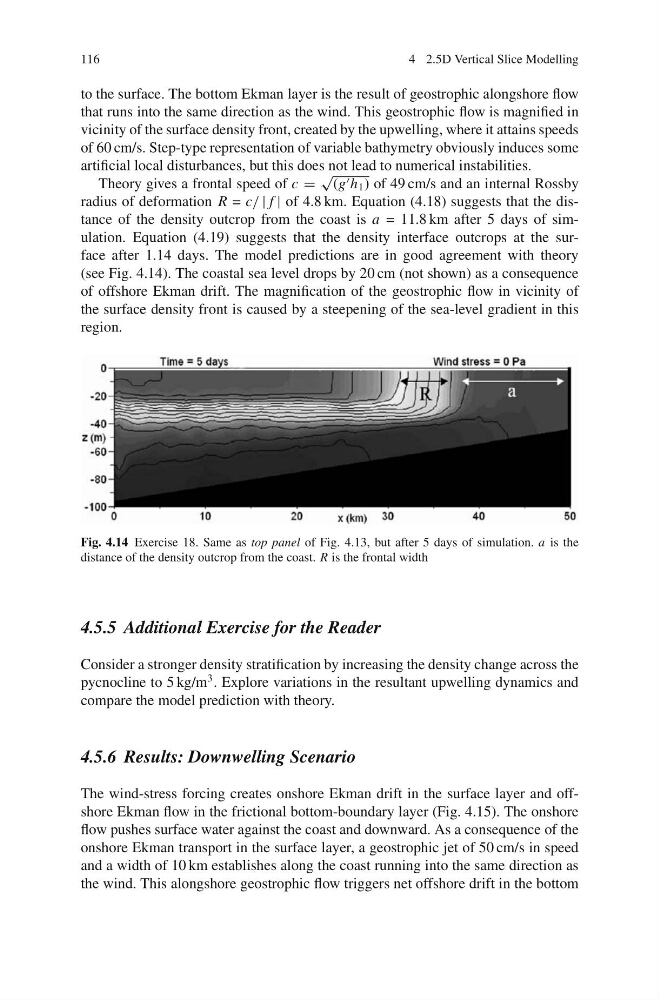
radius of deformation R = c/ | f | of 4.8 km. Equation (4.18) suggests that the distance of the density outcrop from the coast is a = 11.8 km after 5 days of simulation. Equation (4.19) suggests that the density interface outcrops at the surface after 1.14 days. The model predictions are in good agreement with theory
(see Fig. 4.14). The coastal sea level drops by 20 cm (not shown) as a consequence
of offshore Ekman drift. The magnification of the geostrophic flow in vicinity of
the surface density front is caused by a steepening of the sea-level gradient in this
region.
Fig. 4.14 Exercise 18. Same as top panel of Fig. 4.13, but after 5 days of simulation. a is the
distance of the density outcrop from the coast. R is the frontal width
4.5.5 Additional Exercise for the Reader
Consider a stronger density stratification by increasing the density change across the
pycnocline to 5 kg/m
3 . Explore variations in the resultant upwelling dynamics and
compare the model prediction with theory.
4.5.6 Results: Downwelling Scenario
The wind-stress forcing creates onshore Ekman drift in the surface layer and offshore Ekman flow in the frictional bottom-boundary layer (Fig. 4.15). The onshore
flow pushes surface water against the coast and downward. As a consequence of the
onshore Ekman transport in the surface layer, a geostrophic jet of 50 cm/s in speed
and a width of 10 km establishes along the coast running into the same direction as
the wind. This alongshore geostrophic flow triggers net offshore drift in the bottom
4 2.5D Vertical Slice Modelling
to the surface. The bottom Ekman layer is the result of geostrophic alongshore flow
that runs into the same direction as the wind. This geostrophic flow is magnified in
vicinity of the surface density front, created by the upwelling, where it attains speeds
of 60 cm/s. Step-type representation of variable bathymetry obviously induces some
artificial local disturbances, but this does not lead to numerical instabilities.
Theory gives a frontal speed of c =
√
(g h 1 ) of 49 cm/s and an internal Rossby
radius of deformation R = c/ | f | of 4.8 km. Equation (4.18) suggests that the distance of the density outcrop from the coast is a = 11.8 km after 5 days of simulation. Equation (4.19) suggests that the density interface outcrops at the surface after 1.14 days. The model predictions are in good agreement with theory
(see Fig. 4.14). The coastal sea level drops by 20 cm (not shown) as a consequence
of offshore Ekman drift. The magnification of the geostrophic flow in vicinity of
the surface density front is caused by a steepening of the sea-level gradient in this
region.
Fig. 4.14 Exercise 18. Same as top panel of Fig. 4.13, but after 5 days of simulation. a is the
distance of the density outcrop from the coast. R is the frontal width
4.5.5 Additional Exercise for the Reader
Consider a stronger density stratification by increasing the density change across the
pycnocline to 5 kg/m
3 . Explore variations in the resultant upwelling dynamics and
compare the model prediction with theory.
4.5.6 Results: Downwelling Scenario
The wind-stress forcing creates onshore Ekman drift in the surface layer and offshore Ekman flow in the frictional bottom-boundary layer (Fig. 4.15). The onshore
flow pushes surface water against the coast and downward. As a consequence of the
onshore Ekman transport in the surface layer, a geostrophic jet of 50 cm/s in speed
and a width of 10 km establishes along the coast running into the same direction as
the wind. This alongshore geostrophic flow triggers net offshore drift in the bottom