

4 Discoveries About Tropical Cyclones Provided by Microwave Remote Sensing
67
collection on short notice. Extreme waves and wind structures at so-called mesoscale have been observed with these data and similar data are now available from
the European environmental satellite, ENVISAT (e.g. Lehner et al., 1998, 2000).
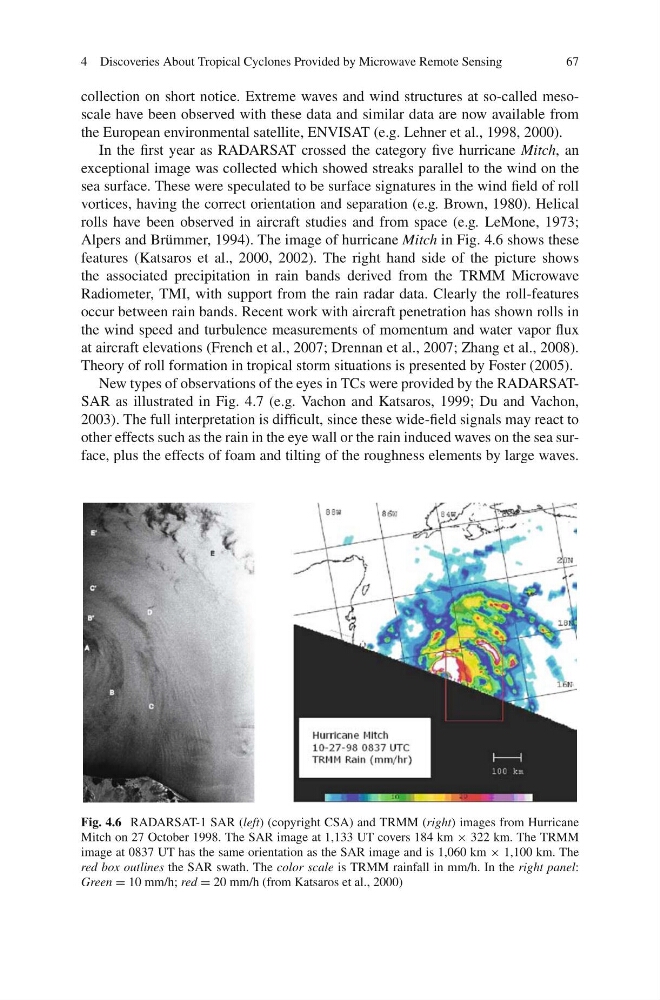
In the first year as RADARSAT crossed the category five hurricane Mitch, an
exceptional image was collected which showed streaks parallel to the wind on the
sea surface. These were speculated to be surface signatures in the wind field of roll
vortices, having the correct orientation and separation (e.g. Brown, 1980). Helical
rolls have been observed in aircraft studies and from space (e.g. LeMone, 1973;
Alpers and Brümmer, 1994). The image of hurricane Mitch in Fig. 4.6 shows these
features (Katsaros et al., 2000, 2002). The right hand side of the picture shows
the associated precipitation in rain bands derived from the TRMM Microwave
Radiometer, TMI, with support from the rain radar data. Clearly the roll-features
occur between rain bands. Recent work with aircraft penetration has shown rolls in
the wind speed and turbulence measurements of momentum and water vapor flux
at aircraft elevations (French et al., 2007; Drennan et al., 2007; Zhang et al., 2008).
Theory of roll formation in tropical storm situations is presented by Foster (2005).
New types of observations of the eyes in TCs were provided by the RADARSATSAR as illustrated in Fig. 4.7 (e.g. Vachon and Katsaros, 1999; Du and Vachon,
2003). The full interpretation is difficult, since these wide-field signals may react to
other effects such as the rain in the eye wall or the rain induced waves on the sea surface, plus the effects of foam and tilting of the roughness elements by large waves.
Fig. 4.6 RADARSAT-1 SAR (left) (copyright CSA) and TRMM (right) images from Hurricane
Mitch on 27 October 1998. The SAR image at 1,133 UT covers 184 km × 322 km. The TRMM
image at 0837 UT has the same orientation as the SAR image and is 1,060 km × 1,100 km. The
red box outlines the SAR swath. The color scale is TRMM rainfall in mm/h. In the right panel:
Green = 10 mm/h; red = 20 mm/h (from Katsaros et al., 2000)
67
collection on short notice. Extreme waves and wind structures at so-called mesoscale have been observed with these data and similar data are now available from
the European environmental satellite, ENVISAT (e.g. Lehner et al., 1998, 2000).
In the first year as RADARSAT crossed the category five hurricane Mitch, an
exceptional image was collected which showed streaks parallel to the wind on the
sea surface. These were speculated to be surface signatures in the wind field of roll
vortices, having the correct orientation and separation (e.g. Brown, 1980). Helical
rolls have been observed in aircraft studies and from space (e.g. LeMone, 1973;
Alpers and Brümmer, 1994). The image of hurricane Mitch in Fig. 4.6 shows these
features (Katsaros et al., 2000, 2002). The right hand side of the picture shows
the associated precipitation in rain bands derived from the TRMM Microwave
Radiometer, TMI, with support from the rain radar data. Clearly the roll-features
occur between rain bands. Recent work with aircraft penetration has shown rolls in
the wind speed and turbulence measurements of momentum and water vapor flux
at aircraft elevations (French et al., 2007; Drennan et al., 2007; Zhang et al., 2008).
Theory of roll formation in tropical storm situations is presented by Foster (2005).
New types of observations of the eyes in TCs were provided by the RADARSATSAR as illustrated in Fig. 4.7 (e.g. Vachon and Katsaros, 1999; Du and Vachon,
2003). The full interpretation is difficult, since these wide-field signals may react to
other effects such as the rain in the eye wall or the rain induced waves on the sea surface, plus the effects of foam and tilting of the roughness elements by large waves.
Fig. 4.6 RADARSAT-1 SAR (left) (copyright CSA) and TRMM (right) images from Hurricane
Mitch on 27 October 1998. The SAR image at 1,133 UT covers 184 km × 322 km. The TRMM
image at 0837 UT has the same orientation as the SAR image and is 1,060 km × 1,100 km. The
red box outlines the SAR swath. The color scale is TRMM rainfall in mm/h. In the right panel:
Green = 10 mm/h; red = 20 mm/h (from Katsaros et al., 2000)