

342
R. Arnone et al.
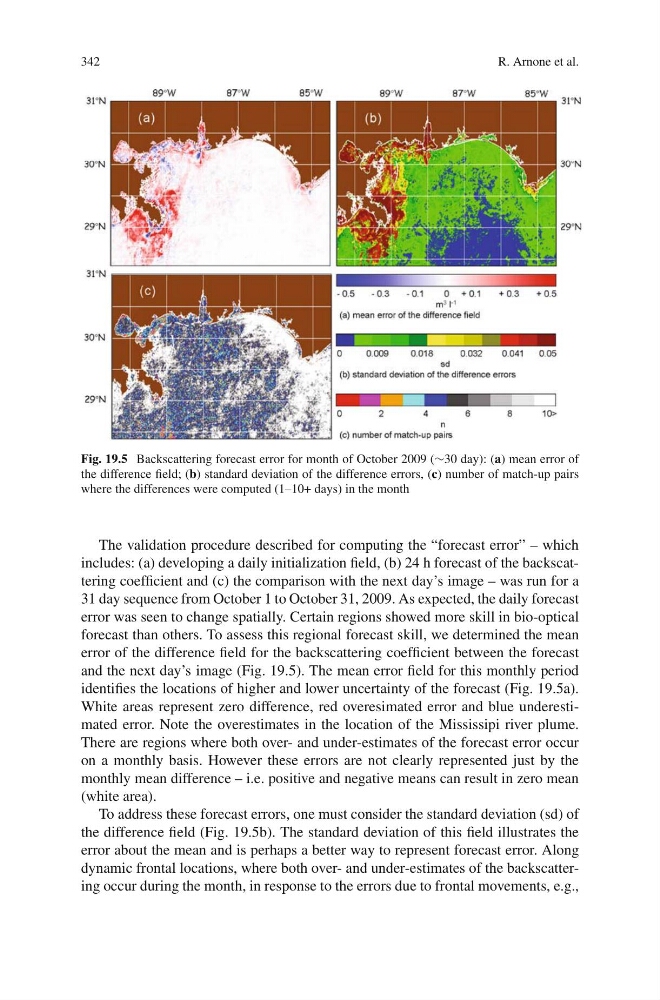
Fig. 19.5 Backscattering forecast error for month of October 2009 (∼30 day): (a) mean error of
the difference field; (b) standard deviation of the difference errors, (c) number of match-up pairs
where the differences were computed (1–10+ days) in the month
The validation procedure described for computing the “forecast error” – which
includes: (a) developing a daily initialization field, (b) 24 h forecast of the backscattering coefficient and (c) the comparison with the next day’s image – was run for a
31 day sequence from October 1 to October 31, 2009. As expected, the daily forecast
error was seen to change spatially. Certain regions showed more skill in bio-optical
forecast than others. To assess this regional forecast skill, we determined the mean
error of the difference field for the backscattering coefficient between the forecast
and the next day’s image (Fig. 19.5). The mean error field for this monthly period
identifies the locations of higher and lower uncertainty of the forecast (Fig. 19.5a).
White areas represent zero difference, red overesimated error and blue underestimated error. Note the overestimates in the location of the Mississipi river plume.
There are regions where both over- and under-estimates of the forecast error occur
on a monthly basis. However these errors are not clearly represented just by the
monthly mean difference – i.e. positive and negative means can result in zero mean
(white area).
To address these forecast errors, one must consider the standard deviation (sd) of
the difference field (Fig. 19.5b). The standard deviation of this field illustrates the
error about the mean and is perhaps a better way to represent forecast error. Along
dynamic frontal locations, where both over- and under-estimates of the backscattering occur during the month, in response to the errors due to frontal movements, e.g.,
R. Arnone et al.
Fig. 19.5 Backscattering forecast error for month of October 2009 (∼30 day): (a) mean error of
the difference field; (b) standard deviation of the difference errors, (c) number of match-up pairs
where the differences were computed (1–10+ days) in the month
The validation procedure described for computing the “forecast error” – which
includes: (a) developing a daily initialization field, (b) 24 h forecast of the backscattering coefficient and (c) the comparison with the next day’s image – was run for a
31 day sequence from October 1 to October 31, 2009. As expected, the daily forecast
error was seen to change spatially. Certain regions showed more skill in bio-optical
forecast than others. To assess this regional forecast skill, we determined the mean
error of the difference field for the backscattering coefficient between the forecast
and the next day’s image (Fig. 19.5). The mean error field for this monthly period
identifies the locations of higher and lower uncertainty of the forecast (Fig. 19.5a).
White areas represent zero difference, red overesimated error and blue underestimated error. Note the overestimates in the location of the Mississipi river plume.
There are regions where both over- and under-estimates of the forecast error occur
on a monthly basis. However these errors are not clearly represented just by the
monthly mean difference – i.e. positive and negative means can result in zero mean
(white area).
To address these forecast errors, one must consider the standard deviation (sd) of
the difference field (Fig. 19.5b). The standard deviation of this field illustrates the
error about the mean and is perhaps a better way to represent forecast error. Along
dynamic frontal locations, where both over- and under-estimates of the backscattering occur during the month, in response to the errors due to frontal movements, e.g.,