

340
R. Arnone et al.
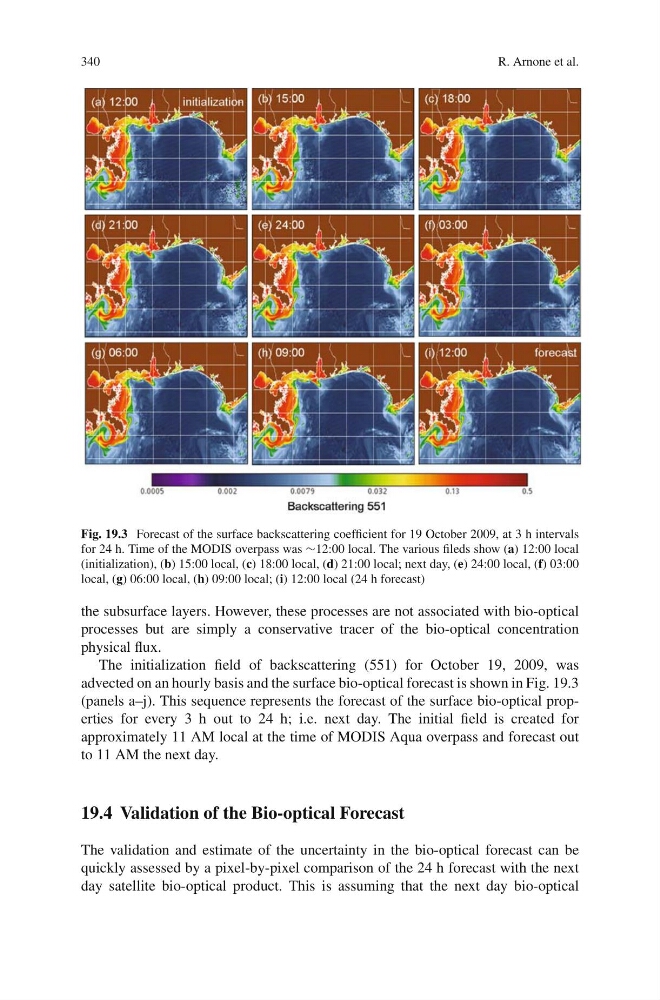
Fig. 19.3 Forecast of the surface backscattering coefficient for 19 October 2009, at 3 h intervals
for 24 h. Time of the MODIS overpass was ∼12:00 local. The various fileds show (a) 12:00 local
(initialization), (b) 15:00 local, (c) 18:00 local, (d) 21:00 local; next day, (e) 24:00 local, (f) 03:00
local, (g) 06:00 local, (h) 09:00 local; (i) 12:00 local (24 h forecast)
the subsurface layers. However, these processes are not associated with bio-optical
processes but are simply a conservative tracer of the bio-optical concentration
physical flux.
The initialization field of backscattering (551) for October 19, 2009, was
advected on an hourly basis and the surface bio-optical forecast is shown in Fig. 19.3
(panels a–j). This sequence represents the forecast of the surface bio-optical properties for every 3 h out to 24 h; i.e. next day. The initial field is created for
approximately 11 AM local at the time of MODIS Aqua overpass and forecast out
to 11 AM the next day.
19.4 Validation of the Bio-optical Forecast
The validation and estimate of the uncertainty in the bio-optical forecast can be
quickly assessed by a pixel-by-pixel comparison of the 24 h forecast with the next
day satellite bio-optical product. This is assuming that the next day bio-optical
R. Arnone et al.
Fig. 19.3 Forecast of the surface backscattering coefficient for 19 October 2009, at 3 h intervals
for 24 h. Time of the MODIS overpass was ∼12:00 local. The various fileds show (a) 12:00 local
(initialization), (b) 15:00 local, (c) 18:00 local, (d) 21:00 local; next day, (e) 24:00 local, (f) 03:00
local, (g) 06:00 local, (h) 09:00 local; (i) 12:00 local (24 h forecast)
the subsurface layers. However, these processes are not associated with bio-optical
processes but are simply a conservative tracer of the bio-optical concentration
physical flux.
The initialization field of backscattering (551) for October 19, 2009, was
advected on an hourly basis and the surface bio-optical forecast is shown in Fig. 19.3
(panels a–j). This sequence represents the forecast of the surface bio-optical properties for every 3 h out to 24 h; i.e. next day. The initial field is created for
approximately 11 AM local at the time of MODIS Aqua overpass and forecast out
to 11 AM the next day.
19.4 Validation of the Bio-optical Forecast
The validation and estimate of the uncertainty in the bio-optical forecast can be
quickly assessed by a pixel-by-pixel comparison of the 24 h forecast with the next
day satellite bio-optical product. This is assuming that the next day bio-optical