

4
J.F.R. Gower
–1.5
–1
–0.5
0
0.5
1
1.5
1955 1960 1965 1970 1975 1980 1985 1990 1995 2000 2005 2010
Start of year
Parts per million
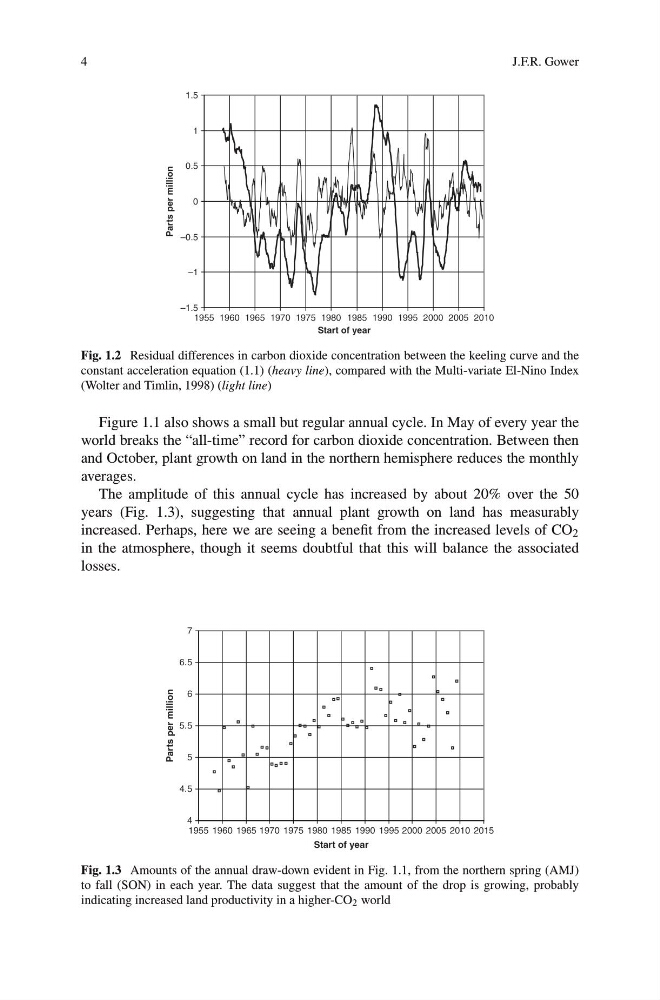
Fig. 1.2 Residual differences in carbon dioxide concentration between the keeling curve and the
constant acceleration equation (1.1) (heavy line), compared with the Multi-variate El-Nino Index
(Wolter and Timlin, 1998) (light line)
Figure 1.1 also shows a small but regular annual cycle. In May of every year the
world breaks the “all-time” record for carbon dioxide concentration. Between then
and October, plant growth on land in the northern hemisphere reduces the monthly
averages.
The amplitude of this annual cycle has increased by about 20% over the 50
years (Fig. 1.3), suggesting that annual plant growth on land has measurably
increased. Perhaps, here we are seeing a benefit from the increased levels of CO 2
in the atmosphere, though it seems doubtful that this will balance the associated
losses.
4
4.5
5
5.5
6
6.5
7
1955 1960 1965 1970 1975 1980 1985 1990 1995 2000 2005 2010 2015
Start of year
Parts per million
Fig. 1.3 Amounts of the annual draw-down evident in Fig. 1.1, from the northern spring (AMJ)
to fall (SON) in each year. The data suggest that the amount of the drop is growing, probably
indicating increased land productivity in a higher-CO 2 world
J.F.R. Gower
–1.5
–1
–0.5
0
0.5
1
1.5
1955 1960 1965 1970 1975 1980 1985 1990 1995 2000 2005 2010
Start of year
Parts per million
Fig. 1.2 Residual differences in carbon dioxide concentration between the keeling curve and the
constant acceleration equation (1.1) (heavy line), compared with the Multi-variate El-Nino Index
(Wolter and Timlin, 1998) (light line)
Figure 1.1 also shows a small but regular annual cycle. In May of every year the
world breaks the “all-time” record for carbon dioxide concentration. Between then
and October, plant growth on land in the northern hemisphere reduces the monthly
averages.
The amplitude of this annual cycle has increased by about 20% over the 50
years (Fig. 1.3), suggesting that annual plant growth on land has measurably
increased. Perhaps, here we are seeing a benefit from the increased levels of CO 2
in the atmosphere, though it seems doubtful that this will balance the associated
losses.
4
4.5
5
5.5
6
6.5
7
1955 1960 1965 1970 1975 1980 1985 1990 1995 2000 2005 2010 2015
Start of year
Parts per million
Fig. 1.3 Amounts of the annual draw-down evident in Fig. 1.1, from the northern spring (AMJ)
to fall (SON) in each year. The data suggest that the amount of the drop is growing, probably
indicating increased land productivity in a higher-CO 2 world