

172
M.-H. Rio
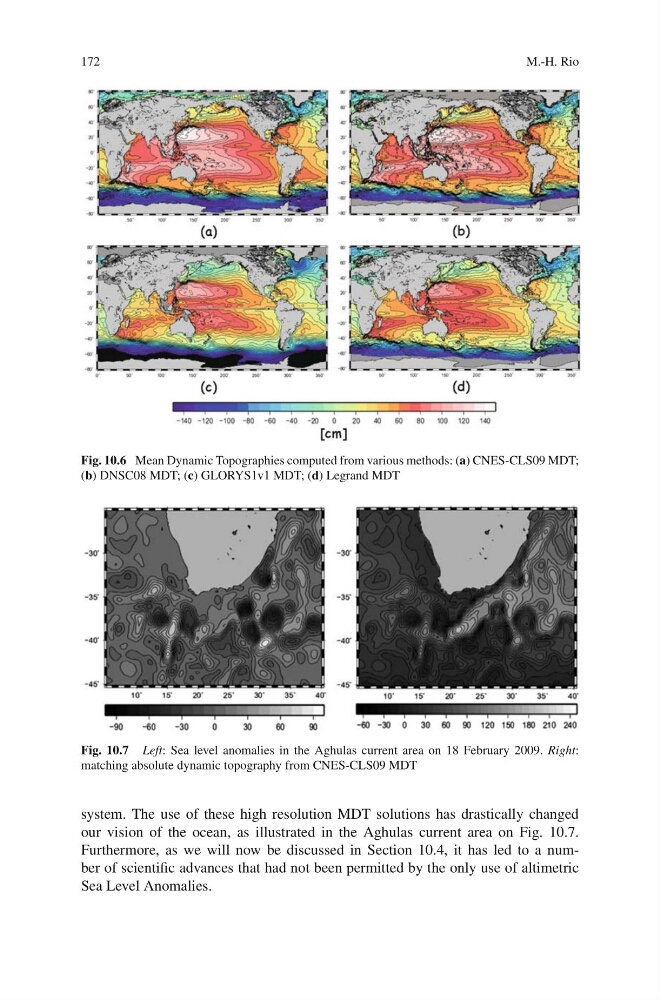
Fig. 10.6 Mean Dynamic Topographies computed from various methods: (a) CNES-CLS09 MDT;
(b) DNSC08 MDT; (c) GLORYS1v1 MDT; (d) Legrand MDT
Fig. 10.7 Left: Sea level anomalies in the Aghulas current area on 18 February 2009. Right:
matching absolute dynamic topography from CNES-CLS09 MDT
system. The use of these high resolution MDT solutions has drastically changed
our vision of the ocean, as illustrated in the Aghulas current area on Fig. 10.7.
Furthermore, as we will now be discussed in Section 10.4, it has led to a number of scientific advances that had not been permitted by the only use of altimetric
Sea Level Anomalies.
M.-H. Rio
Fig. 10.6 Mean Dynamic Topographies computed from various methods: (a) CNES-CLS09 MDT;
(b) DNSC08 MDT; (c) GLORYS1v1 MDT; (d) Legrand MDT
Fig. 10.7 Left: Sea level anomalies in the Aghulas current area on 18 February 2009. Right:
matching absolute dynamic topography from CNES-CLS09 MDT
system. The use of these high resolution MDT solutions has drastically changed
our vision of the ocean, as illustrated in the Aghulas current area on Fig. 10.7.
Furthermore, as we will now be discussed in Section 10.4, it has led to a number of scientific advances that had not been permitted by the only use of altimetric
Sea Level Anomalies.