

8 Perspectives on Oil Spill Detection Using Synthetic Aperture Radar
143
In similar ways, it is possible to derive the oil spill high risk probability areas
(X 4 ) and reduced oil spill detectability areas (X 5 ). Specifically, X 4 is generated
from contextual (distance from traffic lanes and world ports distribution) and from
the fusion of different levels of metocean information (SST gradient, wind turbulences, Chlorophyll-a concentration). Low values of X 5 represent a high probability
of the detection being a look-alike, whereas high X 4 values identify areas with high
probability of having an oil spill.
The SAR detected dark patches labelled by X 1 and the relevant surrounding
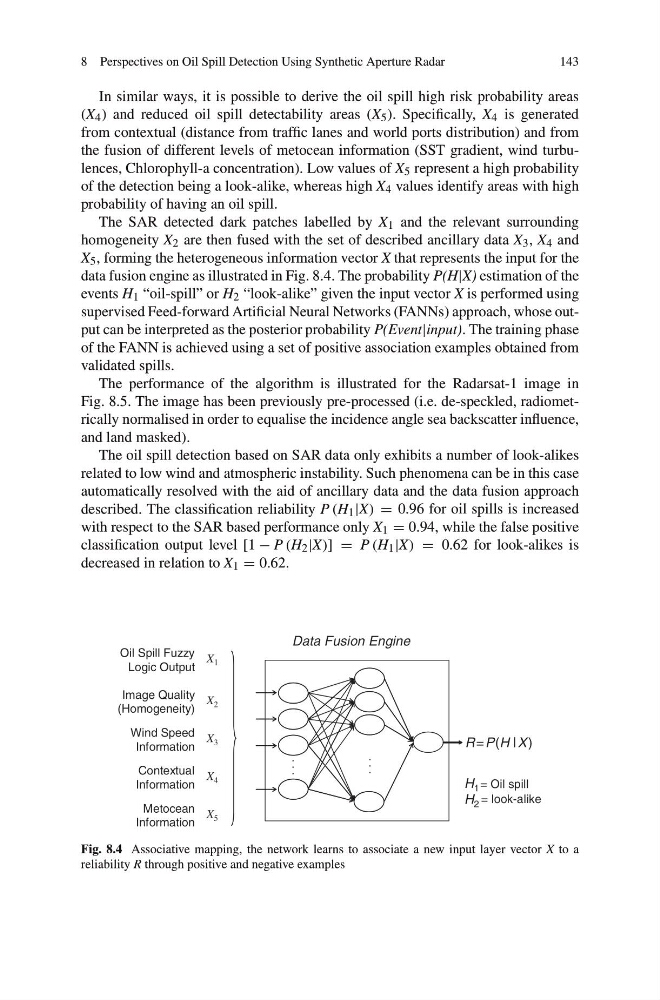
homogeneity X 2 are then fused with the set of described ancillary data X 3 , X 4 and
X 5 , forming the heterogeneous information vector X that represents the input for the
data fusion engine as illustrated in Fig. 8.4. The probability P(H|X) estimation of the
events H 1 “oil-spill” or H 2 “look-alike” given the input vector X is performed using
supervised Feed-forward Artificial Neural Networks (FANNs) approach, whose output can be interpreted as the posterior probability P(Event|input). The training phase
of the FANN is achieved using a set of positive association examples obtained from
validated spills.
The performance of the algorithm is illustrated for the Radarsat-1 image in
Fig. 8.5. The image has been previously pre-processed (i.e. de-speckled, radiometrically normalised in order to equalise the incidence angle sea backscatter influence,
and land masked).
The oil spill detection based on SAR data only exhibits a number of look-alikes
related to low wind and atmospheric instability. Such phenomena can be in this case
automatically resolved with the aid of ancillary data and the data fusion approach
described. The classification reliability P (H 1 |X) = 0.96 for oil spills is increased
with respect to the SAR based performance only X 1 = 0.94, while the false positive
classification output level [1 − P (H 2 |X)] = P (H 1 |X) = 0.62 for look-alikes is
decreased in relation to X 1 = 0.62.
R =P(H |X )
Oil Spill Fuzzy
Logic Output
Image Quality
(Homogeneity)
Wind Speed
Information
Contextual
Information
Metocean
Information
.
.
.
Data Fusion Engine
.
.
.
H 1 = Oil spill
H 2
X 1
X 2
X 4
X 3
X 5
.
.
.
.
.
.
= look-alike
Fig. 8.4 Associative mapping, the network learns to associate a new input layer vector X to a
reliability R through positive and negative examples
143
In similar ways, it is possible to derive the oil spill high risk probability areas
(X 4 ) and reduced oil spill detectability areas (X 5 ). Specifically, X 4 is generated
from contextual (distance from traffic lanes and world ports distribution) and from
the fusion of different levels of metocean information (SST gradient, wind turbulences, Chlorophyll-a concentration). Low values of X 5 represent a high probability
of the detection being a look-alike, whereas high X 4 values identify areas with high
probability of having an oil spill.
The SAR detected dark patches labelled by X 1 and the relevant surrounding
homogeneity X 2 are then fused with the set of described ancillary data X 3 , X 4 and
X 5 , forming the heterogeneous information vector X that represents the input for the
data fusion engine as illustrated in Fig. 8.4. The probability P(H|X) estimation of the
events H 1 “oil-spill” or H 2 “look-alike” given the input vector X is performed using
supervised Feed-forward Artificial Neural Networks (FANNs) approach, whose output can be interpreted as the posterior probability P(Event|input). The training phase
of the FANN is achieved using a set of positive association examples obtained from
validated spills.
The performance of the algorithm is illustrated for the Radarsat-1 image in
Fig. 8.5. The image has been previously pre-processed (i.e. de-speckled, radiometrically normalised in order to equalise the incidence angle sea backscatter influence,
and land masked).
The oil spill detection based on SAR data only exhibits a number of look-alikes
related to low wind and atmospheric instability. Such phenomena can be in this case
automatically resolved with the aid of ancillary data and the data fusion approach
described. The classification reliability P (H 1 |X) = 0.96 for oil spills is increased
with respect to the SAR based performance only X 1 = 0.94, while the false positive
classification output level [1 − P (H 2 |X)] = P (H 1 |X) = 0.62 for look-alikes is
decreased in relation to X 1 = 0.62.
R =P(H |X )
Oil Spill Fuzzy
Logic Output
Image Quality
(Homogeneity)
Wind Speed
Information
Contextual
Information
Metocean
Information
.
.
.
Data Fusion Engine
.
.
.
H 1 = Oil spill
H 2
X 1
X 2
X 4
X 3
X 5
.
.
.
.
.
.
= look-alike
Fig. 8.4 Associative mapping, the network learns to associate a new input layer vector X to a
reliability R through positive and negative examples