

7 Interpretation of SAR Signatures of the Sea Surface
117
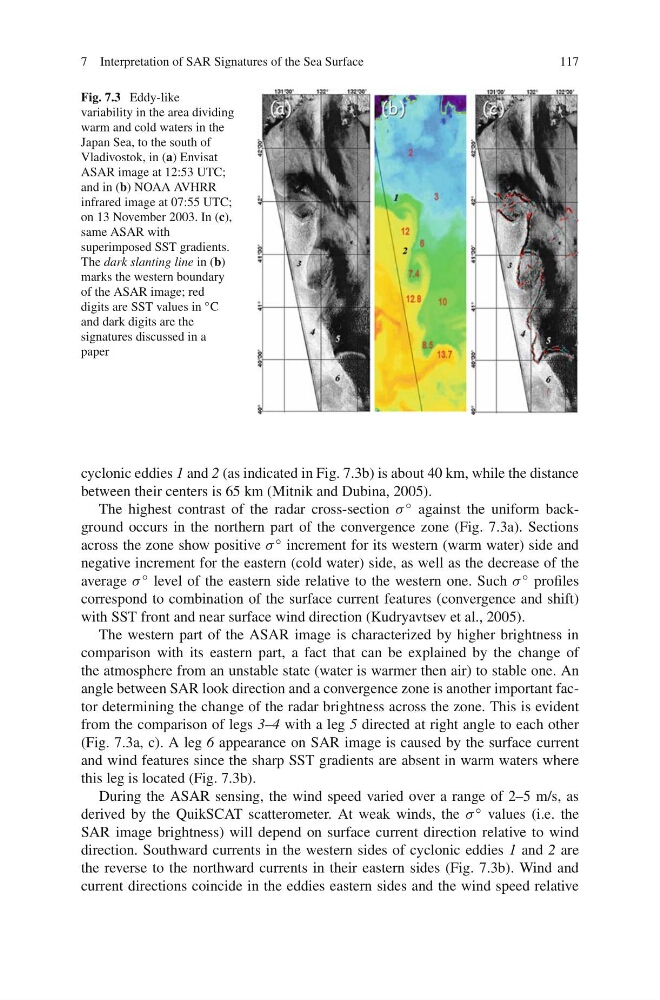
Fig. 7.3 Eddy-like
variability in the area dividing
warm and cold waters in the
Japan Sea, to the south of
Vladivostok, in (a) Envisat
ASAR image at 12:53 UTC;
and in (b) NOAA AVHRR
infrared image at 07:55 UTC;
on 13 November 2003. In (c),
same ASAR with
superimposed SST gradients.
The dark slanting line in (b)
marks the western boundary
of the ASAR image; red
digits are SST values in ◦ C
and dark digits are the
signatures discussed in a
paper
cyclonic eddies 1 and 2 (as indicated in Fig. 7.3b) is about 40 km, while the distance
between their centers is 65 km (Mitnik and Dubina, 2005).
The highest contrast of the radar cross-section σ ◦ against the uniform background occurs in the northern part of the convergence zone (Fig. 7.3a). Sections
across the zone show positive σ ◦ increment for its western (warm water) side and
negative increment for the eastern (cold water) side, as well as the decrease of the
average σ ◦ level of the eastern side relative to the western one. Such σ ◦ profiles
correspond to combination of the surface current features (convergence and shift)
with SST front and near surface wind direction (Kudryavtsev et al., 2005).
The western part of the ASAR image is characterized by higher brightness in
comparison with its eastern part, a fact that can be explained by the change of
the atmosphere from an unstable state (water is warmer then air) to stable one. An
angle between SAR look direction and a convergence zone is another important factor determining the change of the radar brightness across the zone. This is evident
from the comparison of legs 3–4 with a leg 5 directed at right angle to each other
(Fig. 7.3a, c). A leg 6 appearance on SAR image is caused by the surface current
and wind features since the sharp SST gradients are absent in warm waters where
this leg is located (Fig. 7.3b).
During the ASAR sensing, the wind speed varied over a range of 2–5 m/s, as
derived by the QuikSCAT scatterometer. At weak winds, the σ ◦ values (i.e. the
SAR image brightness) will depend on surface current direction relative to wind
direction. Southward currents in the western sides of cyclonic eddies 1 and 2 are
the reverse to the northward currents in their eastern sides (Fig. 7.3b). Wind and
current directions coincide in the eddies eastern sides and the wind speed relative
117
Fig. 7.3 Eddy-like
variability in the area dividing
warm and cold waters in the
Japan Sea, to the south of
Vladivostok, in (a) Envisat
ASAR image at 12:53 UTC;
and in (b) NOAA AVHRR
infrared image at 07:55 UTC;
on 13 November 2003. In (c),
same ASAR with
superimposed SST gradients.
The dark slanting line in (b)
marks the western boundary
of the ASAR image; red
digits are SST values in ◦ C
and dark digits are the
signatures discussed in a
paper
cyclonic eddies 1 and 2 (as indicated in Fig. 7.3b) is about 40 km, while the distance
between their centers is 65 km (Mitnik and Dubina, 2005).
The highest contrast of the radar cross-section σ ◦ against the uniform background occurs in the northern part of the convergence zone (Fig. 7.3a). Sections
across the zone show positive σ ◦ increment for its western (warm water) side and
negative increment for the eastern (cold water) side, as well as the decrease of the
average σ ◦ level of the eastern side relative to the western one. Such σ ◦ profiles
correspond to combination of the surface current features (convergence and shift)
with SST front and near surface wind direction (Kudryavtsev et al., 2005).
The western part of the ASAR image is characterized by higher brightness in
comparison with its eastern part, a fact that can be explained by the change of
the atmosphere from an unstable state (water is warmer then air) to stable one. An
angle between SAR look direction and a convergence zone is another important factor determining the change of the radar brightness across the zone. This is evident
from the comparison of legs 3–4 with a leg 5 directed at right angle to each other
(Fig. 7.3a, c). A leg 6 appearance on SAR image is caused by the surface current
and wind features since the sharp SST gradients are absent in warm waters where
this leg is located (Fig. 7.3b).
During the ASAR sensing, the wind speed varied over a range of 2–5 m/s, as
derived by the QuikSCAT scatterometer. At weak winds, the σ ◦ values (i.e. the
SAR image brightness) will depend on surface current direction relative to wind
direction. Southward currents in the western sides of cyclonic eddies 1 and 2 are
the reverse to the northward currents in their eastern sides (Fig. 7.3b). Wind and
current directions coincide in the eddies eastern sides and the wind speed relative