

7 Interpretation of SAR Signatures of the Sea Surface
115
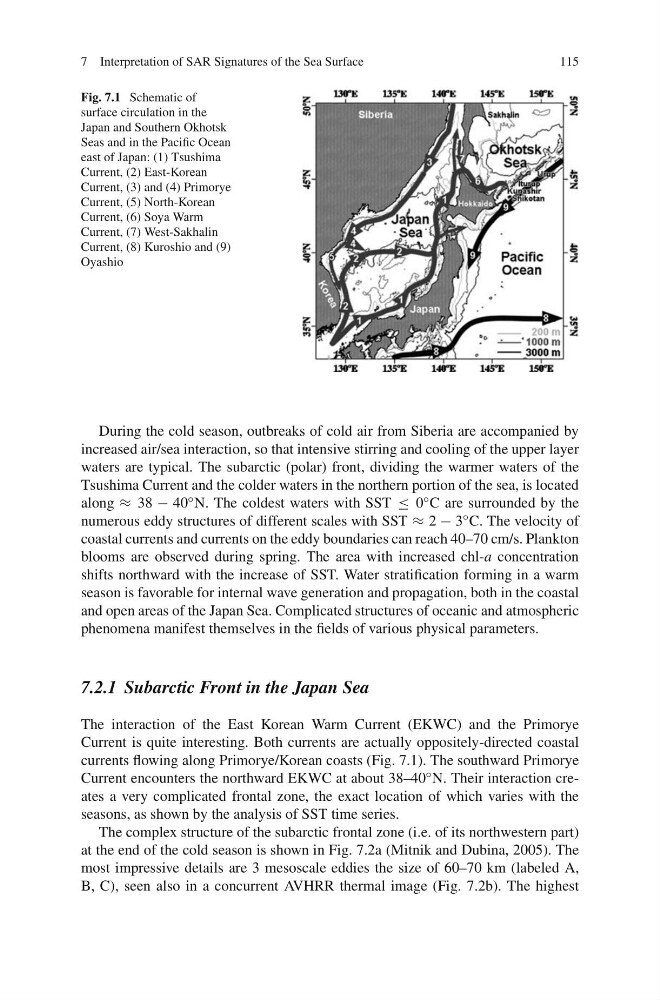
Fig. 7.1 Schematic of
surface circulation in the
Japan and Southern Okhotsk
Seas and in the Pacific Ocean
east of Japan: (1) Tsushima
Current, (2) East-Korean
Current, (3) and (4) Primorye
Current, (5) North-Korean
Current, (6) Soya Warm
Current, (7) West-Sakhalin
Current, (8) Kuroshio and (9)
Oyashio
During the cold season, outbreaks of cold air from Siberia are accompanied by
increased air/sea interaction, so that intensive stirring and cooling of the upper layer
waters are typical. The subarctic (polar) front, dividing the warmer waters of the
Tsushima Current and the colder waters in the northern portion of the sea, is located
along ≈ 38 − 40 ◦ N. The coldest waters with SST ≤ 0 ◦ C are surrounded by the
numerous eddy structures of different scales with SST ≈ 2 − 3 ◦ C. The velocity of
coastal currents and currents on the eddy boundaries can reach 40–70 cm/s. Plankton
blooms are observed during spring. The area with increased chl-a concentration
shifts northward with the increase of SST. Water stratification forming in a warm
season is favorable for internal wave generation and propagation, both in the coastal
and open areas of the Japan Sea. Complicated structures of oceanic and atmospheric
phenomena manifest themselves in the fields of various physical parameters.
7.2.1 Subarctic Front in the Japan Sea
The interaction of the East Korean Warm Current (EKWC) and the Primorye
Current is quite interesting. Both currents are actually oppositely-directed coastal
currents flowing along Primorye/Korean coasts (Fig. 7.1). The southward Primorye
Current encounters the northward EKWC at about 38–40 ◦ N. Their interaction creates a very complicated frontal zone, the exact location of which varies with the
seasons, as shown by the analysis of SST time series.
The complex structure of the subarctic frontal zone (i.e. of its northwestern part)
at the end of the cold season is shown in Fig. 7.2a (Mitnik and Dubina, 2005). The
most impressive details are 3 mesoscale eddies the size of 60–70 km (labeled A,
B, C), seen also in a concurrent AVHRR thermal image (Fig. 7.2b). The highest
115
Fig. 7.1 Schematic of
surface circulation in the
Japan and Southern Okhotsk
Seas and in the Pacific Ocean
east of Japan: (1) Tsushima
Current, (2) East-Korean
Current, (3) and (4) Primorye
Current, (5) North-Korean
Current, (6) Soya Warm
Current, (7) West-Sakhalin
Current, (8) Kuroshio and (9)
Oyashio
During the cold season, outbreaks of cold air from Siberia are accompanied by
increased air/sea interaction, so that intensive stirring and cooling of the upper layer
waters are typical. The subarctic (polar) front, dividing the warmer waters of the
Tsushima Current and the colder waters in the northern portion of the sea, is located
along ≈ 38 − 40 ◦ N. The coldest waters with SST ≤ 0 ◦ C are surrounded by the
numerous eddy structures of different scales with SST ≈ 2 − 3 ◦ C. The velocity of
coastal currents and currents on the eddy boundaries can reach 40–70 cm/s. Plankton
blooms are observed during spring. The area with increased chl-a concentration
shifts northward with the increase of SST. Water stratification forming in a warm
season is favorable for internal wave generation and propagation, both in the coastal
and open areas of the Japan Sea. Complicated structures of oceanic and atmospheric
phenomena manifest themselves in the fields of various physical parameters.
7.2.1 Subarctic Front in the Japan Sea
The interaction of the East Korean Warm Current (EKWC) and the Primorye
Current is quite interesting. Both currents are actually oppositely-directed coastal
currents flowing along Primorye/Korean coasts (Fig. 7.1). The southward Primorye
Current encounters the northward EKWC at about 38–40 ◦ N. Their interaction creates a very complicated frontal zone, the exact location of which varies with the
seasons, as shown by the analysis of SST time series.
The complex structure of the subarctic frontal zone (i.e. of its northwestern part)
at the end of the cold season is shown in Fig. 7.2a (Mitnik and Dubina, 2005). The
most impressive details are 3 mesoscale eddies the size of 60–70 km (labeled A,
B, C), seen also in a concurrent AVHRR thermal image (Fig. 7.2b). The highest