

6 Scatterometer’s Unique Capability in Measuring Ocean Surface Stress
97
at the interface, while C D may still increase since momentum is transported by
form-drag. The heat and moisture transfer coefficients are defined by
H = ρc P C H (T − T s ) (U − U S )
(6.4)
E = ρC E (Q − Q s ) (U − U S )
(6.5)
where c P is the isobaric specific heat, H is the heat flux, E is moisture flux (evaporation). T is the potential temperature, T s the sea surface temperature, and Q is the
specific humidity at a reference level and Q s is the specific humidity at the interface.
Liu’s hypothesis on C H and C E , up to 20 m/s wind speed, as illustrated in Fig. 6.1,
was subsequently supported by measurements in field experiments (e.g. DeCosmo
et al., 1996).
Emanuel (1995) argued, from theoretical and numerical model results, that the
scenario of Liu et al. (1979) could not be extrapolated to the strong wind regime
of a hurricane. To attain the wind strength of a hurricane, the energy dissipated by
drag could not keep increasing while the energy fed by sensible and latent heat does
not increase with wind speed. His results, showing that the maximum wind speed
in mature storm is sensitive to ratio of C H and C E to C D , and that the ratio could
not exceed a very small range, put limit on the increase of C D as a function of wind
speed.
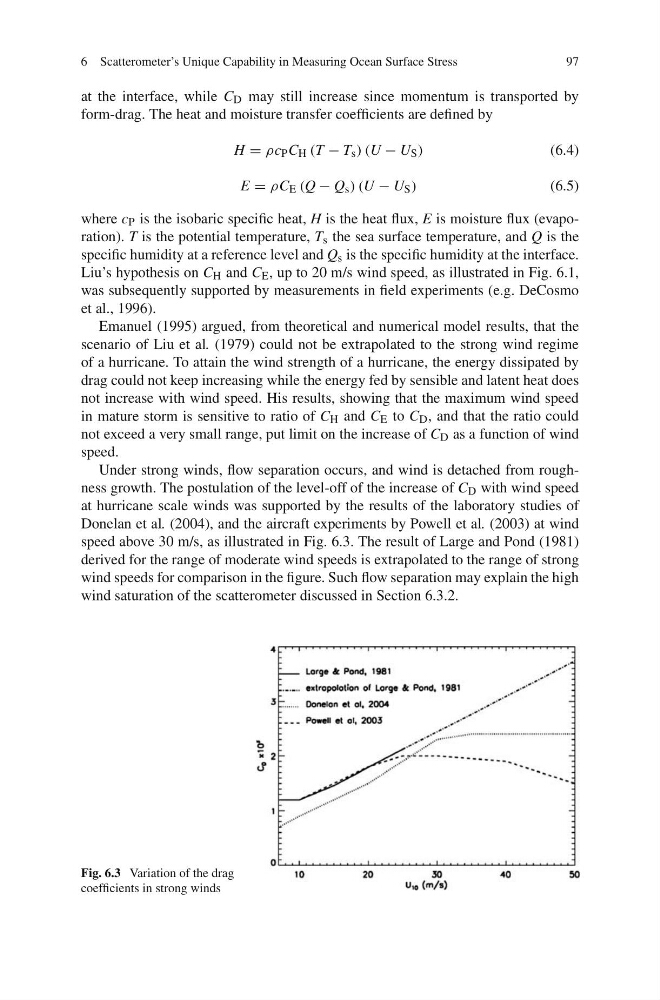
Under strong winds, flow separation occurs, and wind is detached from roughness growth. The postulation of the level-off of the increase of C D with wind speed
at hurricane scale winds was supported by the results of the laboratory studies of
Donelan et al. (2004), and the aircraft experiments by Powell et al. (2003) at wind
speed above 30 m/s, as illustrated in Fig. 6.3. The result of Large and Pond (1981)
derived for the range of moderate wind speeds is extrapolated to the range of strong
wind speeds for comparison in the figure. Such flow separation may explain the high
wind saturation of the scatterometer discussed in Section 6.3.2.
Fig. 6.3 Variation of the drag
coefficients in strong winds
97
at the interface, while C D may still increase since momentum is transported by
form-drag. The heat and moisture transfer coefficients are defined by
H = ρc P C H (T − T s ) (U − U S )
(6.4)
E = ρC E (Q − Q s ) (U − U S )
(6.5)
where c P is the isobaric specific heat, H is the heat flux, E is moisture flux (evaporation). T is the potential temperature, T s the sea surface temperature, and Q is the
specific humidity at a reference level and Q s is the specific humidity at the interface.
Liu’s hypothesis on C H and C E , up to 20 m/s wind speed, as illustrated in Fig. 6.1,
was subsequently supported by measurements in field experiments (e.g. DeCosmo
et al., 1996).
Emanuel (1995) argued, from theoretical and numerical model results, that the
scenario of Liu et al. (1979) could not be extrapolated to the strong wind regime
of a hurricane. To attain the wind strength of a hurricane, the energy dissipated by
drag could not keep increasing while the energy fed by sensible and latent heat does
not increase with wind speed. His results, showing that the maximum wind speed
in mature storm is sensitive to ratio of C H and C E to C D , and that the ratio could
not exceed a very small range, put limit on the increase of C D as a function of wind
speed.
Under strong winds, flow separation occurs, and wind is detached from roughness growth. The postulation of the level-off of the increase of C D with wind speed
at hurricane scale winds was supported by the results of the laboratory studies of
Donelan et al. (2004), and the aircraft experiments by Powell et al. (2003) at wind
speed above 30 m/s, as illustrated in Fig. 6.3. The result of Large and Pond (1981)
derived for the range of moderate wind speeds is extrapolated to the range of strong
wind speeds for comparison in the figure. Such flow separation may explain the high
wind saturation of the scatterometer discussed in Section 6.3.2.
Fig. 6.3 Variation of the drag
coefficients in strong winds