

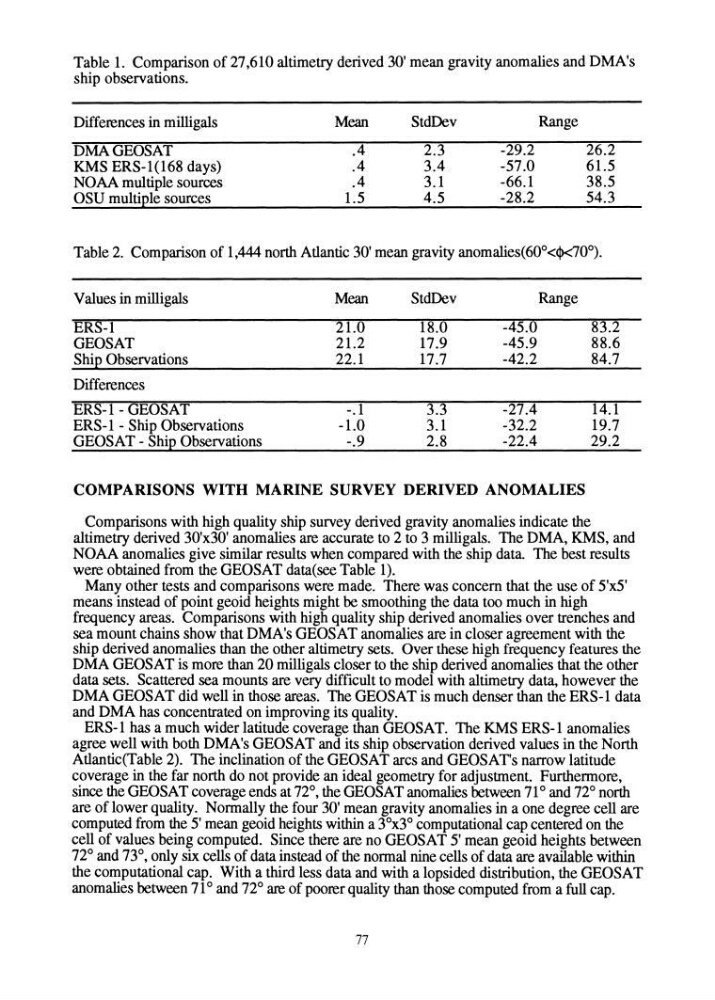
Table 1. Comparison of 27,610 altimetry derived 30' mean gravity anomalies and DMA's
ship observations.
Differences in milligals
Mean
StdDev
Range
DMAGEOSAT
.4
2.3
-29.2
26.2
KMS ERS-l(168 days)
.4
3.4
-57.0
61.5
NOAA multiple sources
.4
3.1
-66.1
38.5
OSU multiple sources
1.5
4.5
-28.2
54.3
Table 2. Comparison of 1,444 north Atlantic 30' mean gravity anomalies(600<
Mean
StdDev
Range
ERS-l
21.0
18.0
-45.0
83.2
GEOSAT
21.2
17.9
-45.9
88.6
Ship Observations
22.1
17.7
-42.2
84.7
Differences
ERS-l - GEOSAT
-.1
3.3
-27.4
14.1
ERS-l - Ship Observations
-1.0
3.1
-32.2
19.7
GEOSAT - Ship Observations
-.9
2.8
-22.4
29.2
COMPARISONS WITH MARINE SURVEY DERIVED ANOMALIES
Comparisons with high quality ship survey derived gravity anomalies indicate the
altimetry derived 30'x30' anomalies are accurate to 2 to 3 milligals. The DMA, KMS, and
NOAA anomalies give similar results when compared with the ship data. The best results
were obtained from the GEOSAT data(see Table 1).
Many other tests and comparisons were made. There was concern that the use of 5'x5'
means instead of point geoid heights might be smoothing the data too much in high
frequency areas. Comparisons with high quality ship derived anomalies over trenches and
sea mount chains show that DMA's GEOSAT anomalies are in closer agreement with the
ship derived anomalies than the other altimetry sets. Over these high frequency features the
DMA GEOSAT is more than 20 milligals closer to the ship derived anomalies that the other
data sets. Scattered sea mounts are very difficult to model with altimetry data, however the
DMA GEOSAT did well in those areas. The GEOSAT is much denser than the ERS-l data
and DMA has concentrated on improving its qUality.
ERS-l has a much wider latitude coverage than GEOSAT. The KMS ERS-l anomalies
agree well with both DMA's GEOSAT and its ship observation derived values in the North
Atlantic(Table 2). The inclination of the GEOSAT arcs and GEOSA Ts narrow latitude
coverage in the far north do not provide an ideal geometry for adjustment. Furthermore,
since the GEOSAT coverage ends at 72°, the GEOSAT anomalies between 71 ° and 72° north
are of lower qUality. Normally the four 30' mean gravity anomalies in a one degree cell are
computed from the 5' mean geoid heights within a 3°x3° computational cap centered on the
cell of values being computed. Since there are no GEOSAT 5' mean geoid heights between
72° and 73°, only six cells of data instead of the normal nine cells of data are available within
the computational cap. With a third less data and with a lopsided distribution, the GEOSAT
anomalies between 71 ° and 72° are of poorer quality than those computed from a full cap.
77
ship observations.
Differences in milligals
Mean
StdDev
Range
DMAGEOSAT
.4
2.3
-29.2
26.2
KMS ERS-l(168 days)
.4
3.4
-57.0
61.5
NOAA multiple sources
.4
3.1
-66.1
38.5
OSU multiple sources
1.5
4.5
-28.2
54.3
Table 2. Comparison of 1,444 north Atlantic 30' mean gravity anomalies(600<
Mean
StdDev
Range
ERS-l
21.0
18.0
-45.0
83.2
GEOSAT
21.2
17.9
-45.9
88.6
Ship Observations
22.1
17.7
-42.2
84.7
Differences
ERS-l - GEOSAT
-.1
3.3
-27.4
14.1
ERS-l - Ship Observations
-1.0
3.1
-32.2
19.7
GEOSAT - Ship Observations
-.9
2.8
-22.4
29.2
COMPARISONS WITH MARINE SURVEY DERIVED ANOMALIES
Comparisons with high quality ship survey derived gravity anomalies indicate the
altimetry derived 30'x30' anomalies are accurate to 2 to 3 milligals. The DMA, KMS, and
NOAA anomalies give similar results when compared with the ship data. The best results
were obtained from the GEOSAT data(see Table 1).
Many other tests and comparisons were made. There was concern that the use of 5'x5'
means instead of point geoid heights might be smoothing the data too much in high
frequency areas. Comparisons with high quality ship derived anomalies over trenches and
sea mount chains show that DMA's GEOSAT anomalies are in closer agreement with the
ship derived anomalies than the other altimetry sets. Over these high frequency features the
DMA GEOSAT is more than 20 milligals closer to the ship derived anomalies that the other
data sets. Scattered sea mounts are very difficult to model with altimetry data, however the
DMA GEOSAT did well in those areas. The GEOSAT is much denser than the ERS-l data
and DMA has concentrated on improving its qUality.
ERS-l has a much wider latitude coverage than GEOSAT. The KMS ERS-l anomalies
agree well with both DMA's GEOSAT and its ship observation derived values in the North
Atlantic(Table 2). The inclination of the GEOSAT arcs and GEOSA Ts narrow latitude
coverage in the far north do not provide an ideal geometry for adjustment. Furthermore,
since the GEOSAT coverage ends at 72°, the GEOSAT anomalies between 71 ° and 72° north
are of lower qUality. Normally the four 30' mean gravity anomalies in a one degree cell are
computed from the 5' mean geoid heights within a 3°x3° computational cap centered on the
cell of values being computed. Since there are no GEOSAT 5' mean geoid heights between
72° and 73°, only six cells of data instead of the normal nine cells of data are available within
the computational cap. With a third less data and with a lopsided distribution, the GEOSAT
anomalies between 71 ° and 72° are of poorer quality than those computed from a full cap.
77