

.....
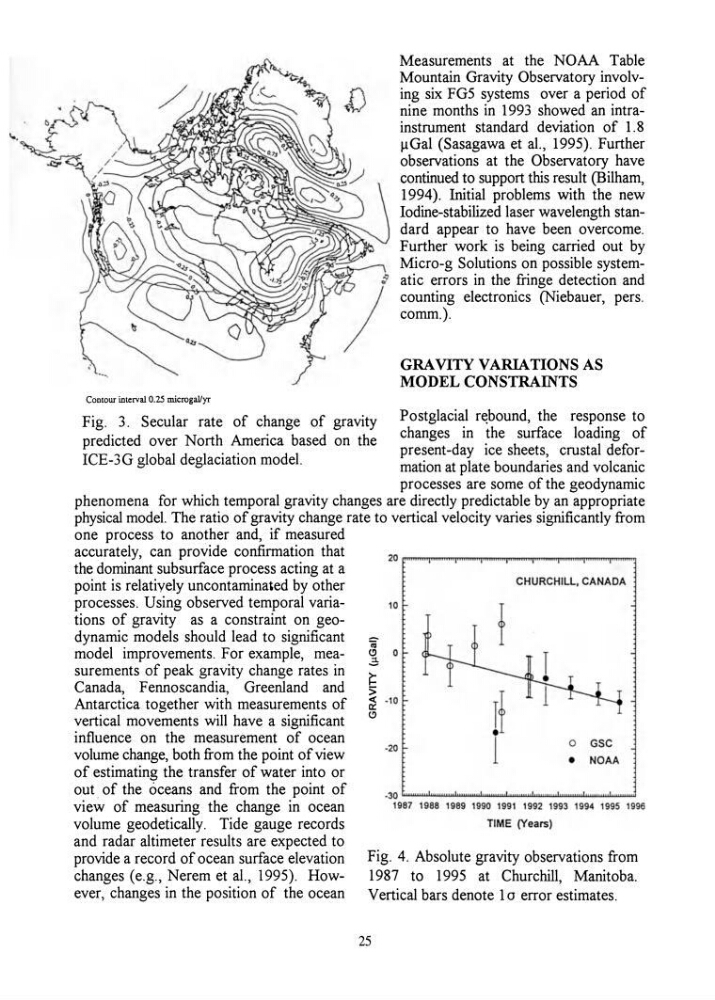
Contour interval 0.25 microgallyr
Fig. 3. Secular rate of change of gravity
predicted over North America based on the
ICE-3G global deglaciation model.
Measurements at the NOAA Table
Mountain Gravity Observatory involving six FG5 systems over a period of
nine months in 1993 showed an intrainstrument standard deviation of 1.8
JlGal (Sasagawa et aI., 1995). Further
observations at the Observatory have
continued to support this result (Bilham,
1994). Initial problems with the new
Iodine-stabilized laser wavelength standard appear to have been overcome.
Further work is being carried out by
Micro-g Solutions on possible systematic errors in the fringe detection and
counting electronics (Niebauer, pers.
comm.).
GRA VITY VARIATIONS AS
MODEL CONSTRAINTS
Postglacial r~bound, the response to
changes in the surface loading of
present-day ice sheets, crustal deformation at plate boundaries and volcanic
processes are some of the geodynamic
phenomena for which temporal gravity changes are directly predictable by an appropriate
physical model. The ratio of gravity change rate to vertical velocity varies significantly from
one process to another and, if measured
accurately, can provide confirmation that
the dominant subsurface process acting at a
point is relatively uncontarninaied by other
processes. Using observed temporal variations of gravity as a constraint on geo10
CHURCHILL, CANADA
dynamic models should lead to significant
iii
model improvements. For example, mea~ 0
surements of peak gravity change rates in
Canada, Fennoscandia, Greenland and
Antarctica together with measurements of
vertical movements will have a significant
influence on the measurement of ocean
volume change, both from the point of view
of estimating the transfer of water into or
out of the oceans and from the point of
view of measuring the change in ocean
volume geodetically. Tide gauge records
and radar altimeter results are expected to
provide a record of ocean surface elevation
changes (e.g., Nerem et aI., 1995). However, changes in the position of the ocean
·20
If
1
o GSC
•
NOAA
.30 ............................. .Iwwo..w...........,J ........ .w....~ .......... ....J............J............J
1987 1988 1989 1990 1991 1992 1993 1994 1995 1996
TIME (Years)
Fig. 4. Absolute gravity observations from
1987 to 1995 at Churchill, Manitoba.
Vertical bars denote 1 a error estimates.
25
Contour interval 0.25 microgallyr
Fig. 3. Secular rate of change of gravity
predicted over North America based on the
ICE-3G global deglaciation model.
Measurements at the NOAA Table
Mountain Gravity Observatory involving six FG5 systems over a period of
nine months in 1993 showed an intrainstrument standard deviation of 1.8
JlGal (Sasagawa et aI., 1995). Further
observations at the Observatory have
continued to support this result (Bilham,
1994). Initial problems with the new
Iodine-stabilized laser wavelength standard appear to have been overcome.
Further work is being carried out by
Micro-g Solutions on possible systematic errors in the fringe detection and
counting electronics (Niebauer, pers.
comm.).
GRA VITY VARIATIONS AS
MODEL CONSTRAINTS
Postglacial r~bound, the response to
changes in the surface loading of
present-day ice sheets, crustal deformation at plate boundaries and volcanic
processes are some of the geodynamic
phenomena for which temporal gravity changes are directly predictable by an appropriate
physical model. The ratio of gravity change rate to vertical velocity varies significantly from
one process to another and, if measured
accurately, can provide confirmation that
the dominant subsurface process acting at a
point is relatively uncontarninaied by other
processes. Using observed temporal variations of gravity as a constraint on geo10
CHURCHILL, CANADA
dynamic models should lead to significant
iii
model improvements. For example, mea~ 0
surements of peak gravity change rates in
Canada, Fennoscandia, Greenland and
Antarctica together with measurements of
vertical movements will have a significant
influence on the measurement of ocean
volume change, both from the point of view
of estimating the transfer of water into or
out of the oceans and from the point of
view of measuring the change in ocean
volume geodetically. Tide gauge records
and radar altimeter results are expected to
provide a record of ocean surface elevation
changes (e.g., Nerem et aI., 1995). However, changes in the position of the ocean
·20
If
1
o GSC
•
NOAA
.30 ............................. .Iwwo..w...........,J ........ .w....~ .......... ....J............J............J
1987 1988 1989 1990 1991 1992 1993 1994 1995 1996
TIME (Years)
Fig. 4. Absolute gravity observations from
1987 to 1995 at Churchill, Manitoba.
Vertical bars denote 1 a error estimates.
25