

Table 1. Observed marine !!favitv field . Units are in m2al.
~
.
~
mean
std.dev
mm
ma'l\:.
error
3.3
17.2
-37.2
57.1
< 2.0
Grality field prediction using least squares collocation (LSC).
Altimeter data were selected in the area bounded by 66 0 N and 68
0
N latitude and
6~E and WOE longitude as ShO\\l1 in Figure 1. Stacked and cross-Qver adjusted ERS1 data from the entire 35-day repeat cycle as well as ERS-I data from the entire
geodetic pbase were used. The density and distribution of these data can be seen in
Figure 2, wbere data from the 35-day repeat mission are shown as circles and data
from the geodetic mission are shown with crosses.
OPR data from the 35-day repeat mission and Quick-look OPR data were used for
the analysis. Initially the data were corrected for geophysical and environmental
correction using the standard set of corrections. These include corrections for dry
troposphere, wet troposphere, ionosphere, solid earth tide and elastic ocean tide
correction, using the values provided in the Interim Geophysical Data Records
containing the ERS-l altimetry.
The error standard deviation
associated with the stacked data
was obtained from the standard
deviation
of the
stacked
observations divided by the 67.5
square-root of the number of
repeats used to compute the
stacked observations (typically
18). This generally resulted in
error standard deviations below
0.05m. 410 data from the 35 day
cycle and 3333 data from the
geodetic phase of the ERS-I
satellite were used. This gives a
total of 3734 observations.
Subsequently the contribution
67.0
66.5
+
+ - '+
'"
L + +
I -.,.
~.
- _
-
+ T
~
....
++ + + ++
+
j .. ,.
. .,.
- 1++"
~
.,.
+
· . , . ~ , • --+ _.. . . . . + + + 1+ +1 ++ + ~ + ++ + +
-,. T -.: r---;f +Ti+++ .f++ +++ ++ + ++
I
- TT l.t - - t - --J+ +++ + +5 ++ + ++ + + ++
· .,...... + .. ~ - -. - - ., .. + + + ++ + 'tt + + + + + +
..... .,. + ~. - - ~ - - - .. ++
++ + • + + + + + + + +
;-'-".++ - . ""- -- -f++.: ++~+++j+++1++ +
+-+ +~~-t.-e-- ++
+
+++ +++~+++
TT+t~T'T' I ---r=t" .. 4- ++ .++
+++ .... ++
•
-rrl
-,
'rT
'
..
+T_+T---t: --+ +.,..+ +++ +.-+ +++J+++
~+"'I"" --" - - -"1+++ , ++++++-+ + ++1+++
+ .,. -; .. - - - L,: - - +.,. + "'1+ + + {"' + + + + + + r + + +
+
t . . ; . . - - + - - .. T' + + + + + + + + + + + +1 ++ +
'!..~ ..... T - ... ~ --t + +- ++ + + ++ +. -+,.... ++
;p ' t . . . +,. ! - -- +.,. ... ;.. +. f' + ++ 1+ + + t + + +
.... T
+_.., ___ ~+++ ... +++ +++ +++ +++
-t-"T"'"+ + __ .. _ -' ="' t . . . . +T~+++ +++ +++1'1+++
' +T "":' "
_
--+-~-+++,.. ;r.+ ... +++++t+++~ ++
- 6.5 7.0 7
9.0 9.5
from the OSU91A spherical
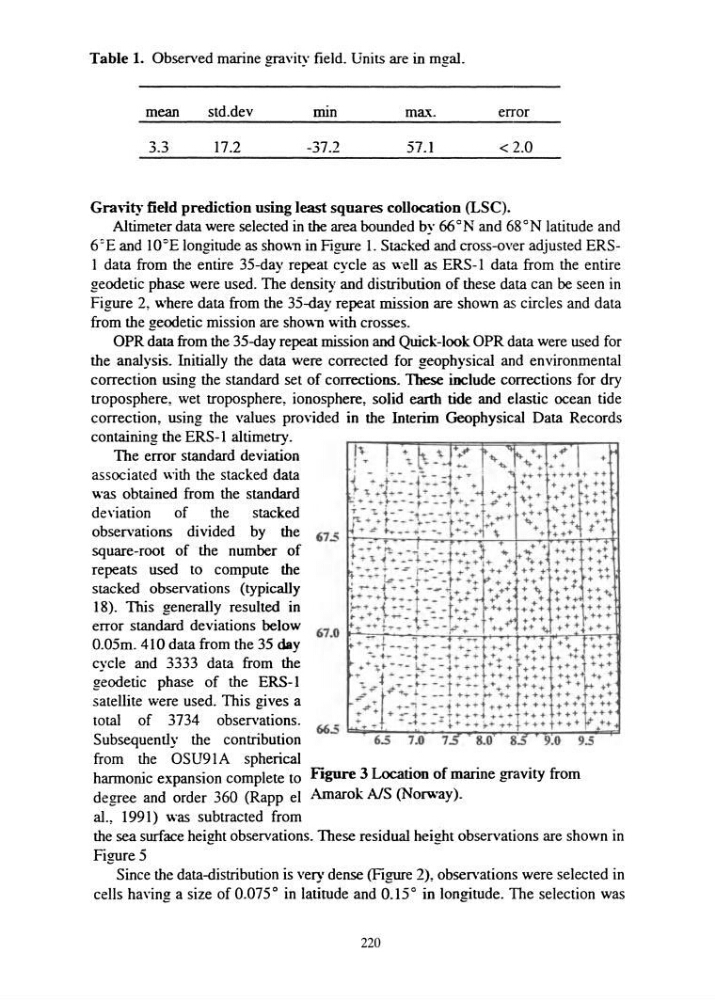
harmonic expansion complete to Figure 3 Location of marine gravity from
degree and order 360 (Rapp el Amarok AlS (Norway).
al., 1991) was subtracted from
the sea surface height observations. These residual height observations are shown in
Figure 5
Since the data-distribution is very dense (Figure 2), observations were selected in
cells havin2 a size of 0.075
0
in latitude and 0.15
0
in loncitude. The selection was
-
-
220
~
.
~
mean
std.dev
mm
ma'l\:.
error
3.3
17.2
-37.2
57.1
< 2.0
Grality field prediction using least squares collocation (LSC).
Altimeter data were selected in the area bounded by 66 0 N and 68
0
N latitude and
6~E and WOE longitude as ShO\\l1 in Figure 1. Stacked and cross-Qver adjusted ERS1 data from the entire 35-day repeat cycle as well as ERS-I data from the entire
geodetic pbase were used. The density and distribution of these data can be seen in
Figure 2, wbere data from the 35-day repeat mission are shown as circles and data
from the geodetic mission are shown with crosses.
OPR data from the 35-day repeat mission and Quick-look OPR data were used for
the analysis. Initially the data were corrected for geophysical and environmental
correction using the standard set of corrections. These include corrections for dry
troposphere, wet troposphere, ionosphere, solid earth tide and elastic ocean tide
correction, using the values provided in the Interim Geophysical Data Records
containing the ERS-l altimetry.
The error standard deviation
associated with the stacked data
was obtained from the standard
deviation
of the
stacked
observations divided by the 67.5
square-root of the number of
repeats used to compute the
stacked observations (typically
18). This generally resulted in
error standard deviations below
0.05m. 410 data from the 35 day
cycle and 3333 data from the
geodetic phase of the ERS-I
satellite were used. This gives a
total of 3734 observations.
Subsequently the contribution
67.0
66.5
+
+ - '+
'"
L + +
I -.,.
~.
- _
-
+ T
~
....
++ + + ++
+
j .. ,.
. .,.
- 1++"
~
.,.
+
· . , . ~ , • --+ _.. . . . . + + + 1+ +1 ++ + ~ + ++ + +
-,. T -.: r---;f +Ti+++ .f++ +++ ++ + ++
I
- TT l.t - - t - --J+ +++ + +5 ++ + ++ + + ++
· .,...... + .. ~ - -. - - ., .. + + + ++ + 'tt + + + + + +
..... .,. + ~. - - ~ - - - .. ++
++ + • + + + + + + + +
;-'-".++ - . ""- -- -f++.: ++~+++j+++1++ +
+-+ +~~-t.-e-- ++
+
+++ +++~+++
TT+t~T'T' I ---r=t" .. 4- ++ .++
+++ .... ++
•
-rrl
-,
'rT
'
..
+T_+T---t: --+ +.,..+ +++ +.-+ +++J+++
~+"'I"" --" - - -"1+++ , ++++++-+ + ++1+++
+ .,. -; .. - - - L,: - - +.,. + "'1+ + + {"' + + + + + + r + + +
+
t . . ; . . - - + - - .. T' + + + + + + + + + + + +1 ++ +
'!..~ ..... T - ... ~ --t + +- ++ + + ++ +. -+,.... ++
;p ' t . . . +,. ! - -- +.,. ... ;.. +. f' + ++ 1+ + + t + + +
.... T
+_.., ___ ~+++ ... +++ +++ +++ +++
-t-"T"'"+ + __ .. _ -' ="' t . . . . +T~+++ +++ +++1'1+++
' +T "":' "
_
--+-~-+++,.. ;r.+ ... +++++t+++~ ++
- 6.5 7.0 7
9.0 9.5
from the OSU91A spherical
harmonic expansion complete to Figure 3 Location of marine gravity from
degree and order 360 (Rapp el Amarok AlS (Norway).
al., 1991) was subtracted from
the sea surface height observations. These residual height observations are shown in
Figure 5
Since the data-distribution is very dense (Figure 2), observations were selected in
cells havin2 a size of 0.075
0
in latitude and 0.15
0
in loncitude. The selection was
-
-
220