

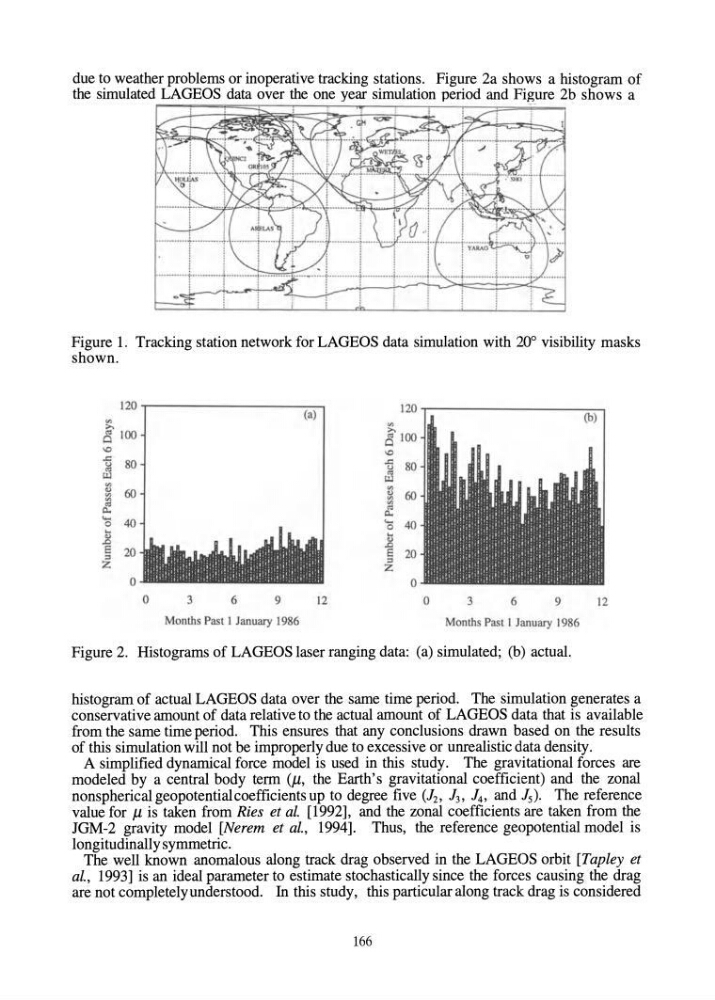
due to weather problems or inoperative tracking stations. Figure 2a shows a histogram of
the simulated LAGEOS data over the one year simulation period and Figure 2b shows a
Figure 1. Tracking station network for LAGEOS data simulation with 20° visibility masks
shown.
120
120
'"
(a)
(b)
;>.,
'"
o:s 100
;>.,
0
Cl 100
\D
10
..c: 80
..c:
u
80
o:s
u
UJ
~
~
60
~
60
'" ~
(I)
(I)
Q.
'"
.....
Q.
0
40
.... 40
..
0
Ol
...
.0
u
E 20
.0
;:I
E 20
Z
;:I
Z
0
0
0
3
6
9
12
0
3
6
9
12
Months Past I January 1986
Months Past I January J 986
Figure 2. Histograms of LAGEOS laser ranging data: (a) simulated; (b) actual.
histogram of actual LAGEOS data over the same time period. The simulation generates a
conservative amount of data relative to the actual amount of LAGEOS data that is available
from the same time period. This ensures that any conclusions drawn based on the results
of this simulation will not be improperly due to excessive or unrealistic data density.
A simplified dynamical force model is used in this study. The gravitational forces are
modeled by a central body term (Il, the Earth's gravitational coefficient) and the zonal
nonspherical geopotentialcoefficients up to degree five (J2, J3, J4, and J 5 ). The reference
value for Il is taken from Ries et al. [1992], and the zonal coefficients are taken from the
JGM-2 gravity model [Nerem et al., 1994]. Thus, the reference geopotential model is
longitudinally symmetric.
The well known anomalous along track drag observed in the LAGEOS orbit [Tapley et
al., 1993] is an ideal parameter to estimate stochastically since the forces causing the drag
are not completely understood. In this study, this particular along track drag is considered
166
the simulated LAGEOS data over the one year simulation period and Figure 2b shows a
Figure 1. Tracking station network for LAGEOS data simulation with 20° visibility masks
shown.
120
120
'"
(a)
(b)
;>.,
'"
o:s 100
;>.,
0
Cl 100
\D
10
..c: 80
..c:
u
80
o:s
u
UJ
~
~
60
~
60
'" ~
(I)
(I)
Q.
'"
.....
Q.
0
40
.... 40
..
0
Ol
...
.0
u
E 20
.0
;:I
E 20
Z
;:I
Z
0
0
0
3
6
9
12
0
3
6
9
12
Months Past I January 1986
Months Past I January J 986
Figure 2. Histograms of LAGEOS laser ranging data: (a) simulated; (b) actual.
histogram of actual LAGEOS data over the same time period. The simulation generates a
conservative amount of data relative to the actual amount of LAGEOS data that is available
from the same time period. This ensures that any conclusions drawn based on the results
of this simulation will not be improperly due to excessive or unrealistic data density.
A simplified dynamical force model is used in this study. The gravitational forces are
modeled by a central body term (Il, the Earth's gravitational coefficient) and the zonal
nonspherical geopotentialcoefficients up to degree five (J2, J3, J4, and J 5 ). The reference
value for Il is taken from Ries et al. [1992], and the zonal coefficients are taken from the
JGM-2 gravity model [Nerem et al., 1994]. Thus, the reference geopotential model is
longitudinally symmetric.
The well known anomalous along track drag observed in the LAGEOS orbit [Tapley et
al., 1993] is an ideal parameter to estimate stochastically since the forces causing the drag
are not completely understood. In this study, this particular along track drag is considered
166