

regions where the residuals with respect to the "Quad" and "Block" models are still large.
These are predominantly regions where the topography is rough, and reflects errors in the
original data, errors in the terrain corrections, and ambiguities in the reference datums for
some of the data. These problems are being investigated and we hope to achieve
improvements before the completion of the final model.
Geoid Differences
The geoid height differences between JGM-2 and the "Quad" model complete to degree
70 (differences between JGM-2 and the "Comb" and "Block" models have similar
characteristics) have been computed in order to analyze the implications for oceanographic
applications. The JGM-2 geoid model has a well-known error in the north-central Pacific
(Nerem et al., 1994c) which has serious consequences for the computation of ocean
dynamic topography using satellite altimetry. Part of this error was corrected with the
development of JGM-3 (Tapley et al., 1994a). Although not shown here, the geoid
differences between "Quad" and JGM-2 indicate that the largest part of the error in JGM-2
has been corrected, with the JGM-2/"Quad" differences in the central Pacific being larger
than the JGM-2/3 differences. Further research is planned to better gauge the performance
of these new geoid models for satellite oceanography.
GPS/Leveling Tests
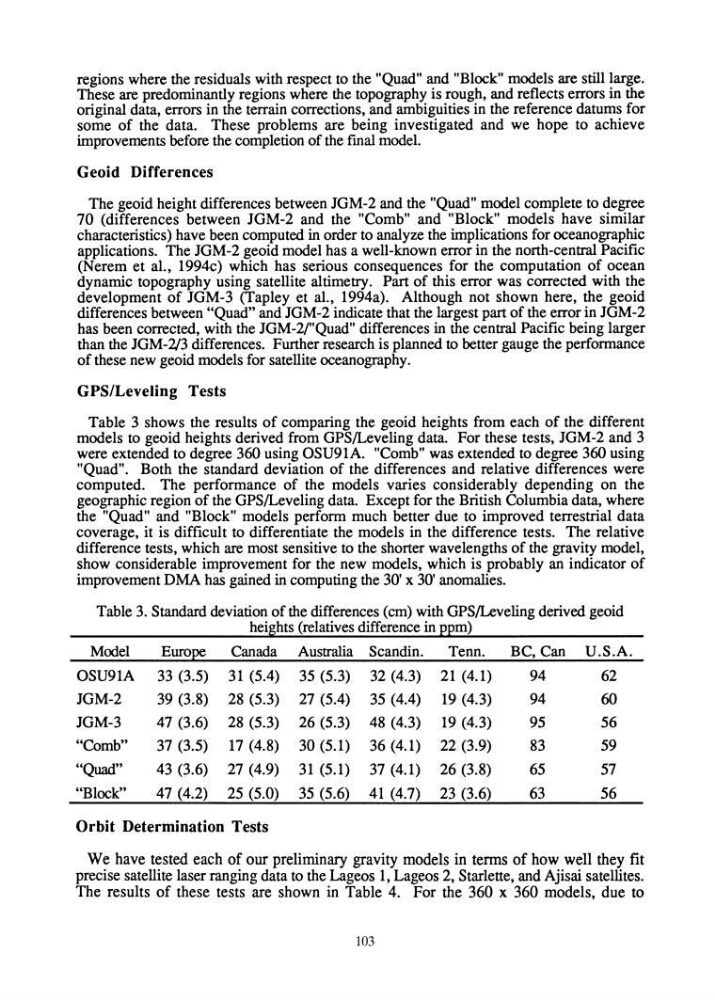
Table 3 shows the results of comparing the geoid heights from each of the different
models to geoid heights derived from GPS/Leveling data. For these tests, JGM-2 and 3
were extended to degree 360 using OSU91A. "Comb" was extended to degree 360 using
"Quad". Both the standard deviation of the differences and relative differences were
computed. The performance of the models varies considerably depending on the
geographic region of the GPS/Leveling data. Except for the British Columbia data, where
the "Quad" and "Block" models perform much better due to improved terrestrial data
coverage, it is difficult to differentiate the models in the difference tests. The relative
difference tests, which are most sensitive to the shorter wavelengths of the gravity model,
show considerable improvement for the new models, which is probably an indicator of
improvement DMA has gained in computing the 30' x 30' anomalies.
Table 3. Standard deviation of the differences (em) with GPS/Leveling derived geoid
hei~hts (relatives difference in ,E,Em)
Model
Euro~
Canada Australia Scandin.
Tenn.
BC, Can U.S.A.
OSU91A 33 (3.5) 31 (5.4) 35 (5.3) 32 (4.3) 21 (4.1)
94
62
JGM-2
39 (3.8) 28 (5.3) 27 (5.4) 35 (4.4) 19 (4.3)
94
60
JGM-3
47 (3.6) 28 (5.3) 26 (5.3) 48 (4.3) 19 (4.3)
95
56
"Comb"
37 (3.5) 17 (4.8) 30 (5.1) 36 (4.1) 22 (3.9)
83
59
"Quad."
43 (3.6) 27 (4.9) 31 (5.1) 37 (4.1) 26 (3.8)
65
57
"Block"
47 (4.2) 25 (5.0) 35 (5.6) 41 (4.7) 23 (3.6)
63
56
Orbit Determination Tests
We have tested each of our preliminary gravity models in terms of how well they fit
precise satellite laser ranging data to the Lageos 1, Lageos 2, Starlette, and Ajisai satellites.
The results of these tests are shown in Table 4. For the 360 x 360 models, due to
103
These are predominantly regions where the topography is rough, and reflects errors in the
original data, errors in the terrain corrections, and ambiguities in the reference datums for
some of the data. These problems are being investigated and we hope to achieve
improvements before the completion of the final model.
Geoid Differences
The geoid height differences between JGM-2 and the "Quad" model complete to degree
70 (differences between JGM-2 and the "Comb" and "Block" models have similar
characteristics) have been computed in order to analyze the implications for oceanographic
applications. The JGM-2 geoid model has a well-known error in the north-central Pacific
(Nerem et al., 1994c) which has serious consequences for the computation of ocean
dynamic topography using satellite altimetry. Part of this error was corrected with the
development of JGM-3 (Tapley et al., 1994a). Although not shown here, the geoid
differences between "Quad" and JGM-2 indicate that the largest part of the error in JGM-2
has been corrected, with the JGM-2/"Quad" differences in the central Pacific being larger
than the JGM-2/3 differences. Further research is planned to better gauge the performance
of these new geoid models for satellite oceanography.
GPS/Leveling Tests
Table 3 shows the results of comparing the geoid heights from each of the different
models to geoid heights derived from GPS/Leveling data. For these tests, JGM-2 and 3
were extended to degree 360 using OSU91A. "Comb" was extended to degree 360 using
"Quad". Both the standard deviation of the differences and relative differences were
computed. The performance of the models varies considerably depending on the
geographic region of the GPS/Leveling data. Except for the British Columbia data, where
the "Quad" and "Block" models perform much better due to improved terrestrial data
coverage, it is difficult to differentiate the models in the difference tests. The relative
difference tests, which are most sensitive to the shorter wavelengths of the gravity model,
show considerable improvement for the new models, which is probably an indicator of
improvement DMA has gained in computing the 30' x 30' anomalies.
Table 3. Standard deviation of the differences (em) with GPS/Leveling derived geoid
hei~hts (relatives difference in ,E,Em)
Model
Euro~
Canada Australia Scandin.
Tenn.
BC, Can U.S.A.
OSU91A 33 (3.5) 31 (5.4) 35 (5.3) 32 (4.3) 21 (4.1)
94
62
JGM-2
39 (3.8) 28 (5.3) 27 (5.4) 35 (4.4) 19 (4.3)
94
60
JGM-3
47 (3.6) 28 (5.3) 26 (5.3) 48 (4.3) 19 (4.3)
95
56
"Comb"
37 (3.5) 17 (4.8) 30 (5.1) 36 (4.1) 22 (3.9)
83
59
"Quad."
43 (3.6) 27 (4.9) 31 (5.1) 37 (4.1) 26 (3.8)
65
57
"Block"
47 (4.2) 25 (5.0) 35 (5.6) 41 (4.7) 23 (3.6)
63
56
Orbit Determination Tests
We have tested each of our preliminary gravity models in terms of how well they fit
precise satellite laser ranging data to the Lageos 1, Lageos 2, Starlette, and Ajisai satellites.
The results of these tests are shown in Table 4. For the 360 x 360 models, due to
103