

Dmitrenko et al.: Oceanographic Causes for Transarctic Ice Transport
75
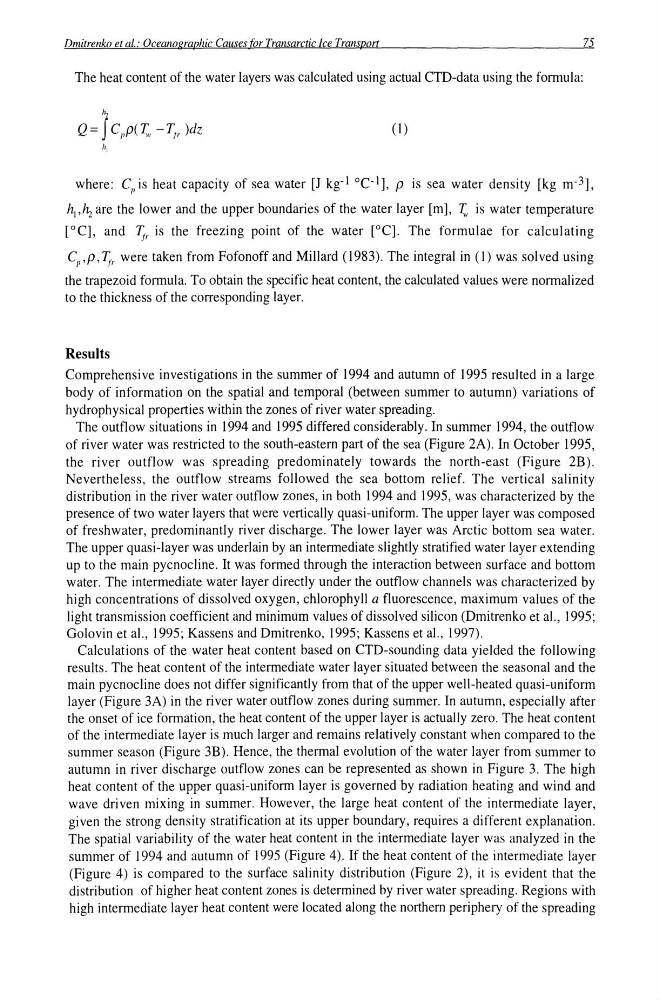
The heat content of the water layers was calculated using actual CTD-data using the formula:
It,
Q= f Cpp(T" -0r )dz
(I)
hi
where: C 1 > is heat capacity of sea water [J kg-1 °C-1], P is sea water density [kg m- 3 ],
h,,~ are the lower and the upper boundaries of the water layer [m], I;, is water temperature
[0C], and ~r is the freezing point of the water [DC]. The formulae for calculating
CI',p, ~r were taken from Fofonoff and Millard (1983). The integral in (I) was solved using
the trapezoid formula. To obtain the specific heat content, the calculated values were normalized
to the thickness of the corresponding layer.
Results
Comprehensive investigations in the summer of 1994 and autumn of 1995 resulted in a large
body of information on the spatial and temporal (between summer to autumn) variations of
hydrophysical properties within the zones of river water spreading.
The outflow situations in 1994 and 1995 differed considerably. In summer 1994, the outflow
of river water was restricted to the south-eastern part of the sea (Figure 2A). In October 1995,
the river outflow was spreading predominately towards the north-east (Figure 2B).
Nevertheless, the outflow streams followed the sea bottom relief. The vertical salinity
distribution in the river water outflow zones, in both 1994 and 1995, was characterized by the
presence of two water layers that were vertically quasi-uniform. The upper layer was composed
of freshwater, predominantly river discharge. The lower layer was Arctic bottom sea water.
The upper quasi-layer was underlain by an intermediate slightly stratified water layer extending
up to the main pycnocline. It was formed through the interaction between surface and bottom
water. The intermediate water layer directly under the outflow channels was characterized by
high concentrations of dissolved oxygen, chlorophyll a fluorescence, maximum values of the
light transmission coefficient and minimum values of dissolved silicon (Dmitrenko et aI., 1995;
Golovin et aI., 1995; Kassens and Dmitrenko, 1995; Kassens et aI., 1997).
Calculations of the water heat content based on CTD-sounding data yielded the following
results. The heat content of the intermediate water layer situated between the seasonal and the
main pycnocline does not differ significantly from that of the upper well-heated quasi-uniform
layer (Figure 3A) in the river water outflow zones during summer. In autumn, especially after
the onset of ice formation, the heat content of the upper layer is actually zero. The heat content
of the intermediate layer is much larger and remains relatively constant when compared to the
summer season (Figure 3B). Hence, the thermal evolution of the water layer from summer to
autumn in river discharge outflow zones can be represented as shown in Figure 3. The high
heat content of the upper quasi-uniform layer is governed by radiation heating and wind and
wave driven mixing in summer. However, the large heat content of the intermediate layer,
given the strong density stratification at its upper boundary, requires a different explanation.
The spatial variability of the water heat content in the intermediate layer was analyzed in the
summer of 1994 and autumn of 1995 (Figure 4). If the heat content of the intermediate layer
(Figure 4) is compared to the surface salinity distribution (Figure 2), it is evident that the
distribution of higher heat content zones is determined by river water spreading. Regions with
high intermediate layer heat content were located along the northern periphery of the spreading
75
The heat content of the water layers was calculated using actual CTD-data using the formula:
It,
Q= f Cpp(T" -0r )dz
(I)
hi
where: C 1 > is heat capacity of sea water [J kg-1 °C-1], P is sea water density [kg m- 3 ],
h,,~ are the lower and the upper boundaries of the water layer [m], I;, is water temperature
[0C], and ~r is the freezing point of the water [DC]. The formulae for calculating
CI',p, ~r were taken from Fofonoff and Millard (1983). The integral in (I) was solved using
the trapezoid formula. To obtain the specific heat content, the calculated values were normalized
to the thickness of the corresponding layer.
Results
Comprehensive investigations in the summer of 1994 and autumn of 1995 resulted in a large
body of information on the spatial and temporal (between summer to autumn) variations of
hydrophysical properties within the zones of river water spreading.
The outflow situations in 1994 and 1995 differed considerably. In summer 1994, the outflow
of river water was restricted to the south-eastern part of the sea (Figure 2A). In October 1995,
the river outflow was spreading predominately towards the north-east (Figure 2B).
Nevertheless, the outflow streams followed the sea bottom relief. The vertical salinity
distribution in the river water outflow zones, in both 1994 and 1995, was characterized by the
presence of two water layers that were vertically quasi-uniform. The upper layer was composed
of freshwater, predominantly river discharge. The lower layer was Arctic bottom sea water.
The upper quasi-layer was underlain by an intermediate slightly stratified water layer extending
up to the main pycnocline. It was formed through the interaction between surface and bottom
water. The intermediate water layer directly under the outflow channels was characterized by
high concentrations of dissolved oxygen, chlorophyll a fluorescence, maximum values of the
light transmission coefficient and minimum values of dissolved silicon (Dmitrenko et aI., 1995;
Golovin et aI., 1995; Kassens and Dmitrenko, 1995; Kassens et aI., 1997).
Calculations of the water heat content based on CTD-sounding data yielded the following
results. The heat content of the intermediate water layer situated between the seasonal and the
main pycnocline does not differ significantly from that of the upper well-heated quasi-uniform
layer (Figure 3A) in the river water outflow zones during summer. In autumn, especially after
the onset of ice formation, the heat content of the upper layer is actually zero. The heat content
of the intermediate layer is much larger and remains relatively constant when compared to the
summer season (Figure 3B). Hence, the thermal evolution of the water layer from summer to
autumn in river discharge outflow zones can be represented as shown in Figure 3. The high
heat content of the upper quasi-uniform layer is governed by radiation heating and wind and
wave driven mixing in summer. However, the large heat content of the intermediate layer,
given the strong density stratification at its upper boundary, requires a different explanation.
The spatial variability of the water heat content in the intermediate layer was analyzed in the
summer of 1994 and autumn of 1995 (Figure 4). If the heat content of the intermediate layer
(Figure 4) is compared to the surface salinity distribution (Figure 2), it is evident that the
distribution of higher heat content zones is determined by river water spreading. Regions with
high intermediate layer heat content were located along the northern periphery of the spreading