

Kim et al.,' High Resolution Seismic Studies in the Laptev Sea Shelf
689
II
Age Lithology
j~
;EE.
Age Lithology ~E
f~
III
- - - - -
Q,v "" - -- - 4
7
_
Seismic
Proposed
Thickness
.
.
Q. -- - - -
" ~ """'=
E(1)-Q,
- 19
&Q, c-CCc. " ~ ••• -~
age
(m)
N, -""'-- ., 40
N " - -
~ D
QtV
4-7
o_~ ' o lJ" (,
"
,
Q
Q
:.4 20
(up to 15)
~ _ _ _ -:' ' ' "; -
r-=---- 4
: a : d ..
- .:::.:::::::::. -
C
Q III
14 - 20
Q
,,.. -' -'
N, _-_- _-_-_-. 76
-;::---- 3
(up 1030)
..
:.' lI' ... ao' "
'_""::"'_',,
B
20 - 50
~ .-.,
- - - - -
2
E-Qll
(up to 80)
-
60 -70
N,
175
- - - - .A
N2
...
(up to 140)
-P, --::.-:~_-:;., __ .
_
-----,
-
v
......
K,--P, ~;::.e:i.e: 20
/
4
~:~4) "... ~ . . . iCI;lQ,
0., • • • •
Q~O""IIoll o~
Clay
D
-----~
. .. Sand
--P.
85
Q'l:iOQ~DCI"~
Silty cloy
Q Coarse deposits
B
-J:-~, c
r-.; : ~ .. Q
Sandy clay
~
Peat
~ _.• •
P,
.- .D " 0 ' 85
Loam
.- .- Plant and wood delritus
0
".
-""
~o
... . . ,
b:d
Sandy silt
-
Coal
....:!L.
..
10
-../
' -
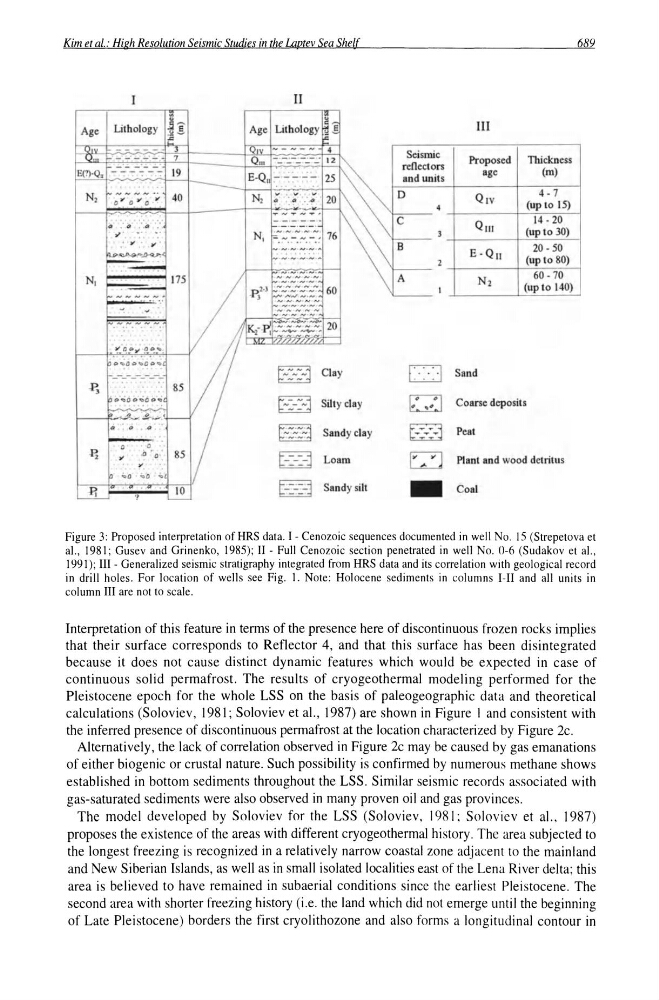
Figure 3: Proposed interpretation of HRS data. I - Cenozoic sequences documented in well No. 15 (Strepetova et
aI., 1981; Gusev and Grinenko, 1985); II - Full Cenozoic section penetrated in well No. 0-6 (Sudakov et aI.,
1991); III - Generalized seismic stratigraphy integrated from HRS data and its correlation with geological record
in drill holes. For location of wells see Fig. 1. Note: Holocene sediments in columns 1-11 and all units in
column III are not to scale.
Interpretation of this feature in terms of the presence here of discontinuous frozen rocks implies
that their surface corresponds to Reflector 4, and that this surface has been disintegrated
because it does not cause distinct dynamic features which would be expected in case of
continuous solid permafrost. The results of cryogeothermal modeling performed for the
Pleistocene epoch for the whole LSS on the basis of paleogeographic data and theoretical
calculations (Soloviev, 1981; Soloviev et aI., 1987) are shown in Figure I and consistent with
the inferred presence of discontinuous permafrost at the location characterized by Figure 2c.
Alternatively, the lack of correlation observed in Figure 2c may be caused by gas emanations
of either biogenic or crustal nature. Such possibility is confirmed by numerous methane shows
established in bottom sediments throughout the LSS. Similar seismic records associated with
gas-saturated sediments were also observed in many proven oil and gas provinces.
The model developed by Soloviev for the LSS (Soloviev, 198 L Soloviev et al., 1987)
proposes the existence of the areas with different cryogeothermal history. The area subjected to
the longest freezing is recognized in a relatively narrow coastal zone adjacent to the mainland
and New Siberian Islands, as well as in small isolated localities east of the Lena River delta; this
area is believed to have remained in subaerial conditions since the earliest Pleistocene. The
second area with shorter freezing history (i.e. the land which did not emerge until the beginning
of Late Pleistocene) borders the first cryolithozone and also forms a longitudinal contour in
689
II
Age Lithology
j~
;EE.
Age Lithology ~E
f~
III
- - - - -
Q,v "" - -- - 4
7
_
Seismic
Proposed
Thickness
.
.
Q. -- - - -
" ~ """'=
E(1)-Q,
- 19
&Q, c-CCc. " ~ ••• -~
age
(m)
N, -""'-- ., 40
N " - -
~ D
QtV
4-7
o_~ ' o lJ" (,
"
,
Q
Q
:.4 20
(up to 15)
~ _ _ _ -:' ' ' "; -
r-=---- 4
: a : d ..
- .:::.:::::::::. -
C
Q III
14 - 20
Q
,,.. -' -'
N, _-_- _-_-_-. 76
-;::---- 3
(up 1030)
..
:.' lI' ... ao' "
'_""::"'_',,
B
20 - 50
~ .-.,
- - - - -
2
E-Qll
(up to 80)
-
60 -70
N,
175
- - - - .A
N2
...
(up to 140)
-P, --::.-:~_-:;., __ .
_
-----,
-
v
......
K,--P, ~;::.e:i.e: 20
/
4
~:~4) "... ~ . . . iCI;lQ,
0., • • • •
Q~O""IIoll o~
Clay
D
-----~
. .. Sand
--P.
85
Q'l:iOQ~DCI"~
Silty cloy
Q Coarse deposits
B
-J:-~, c
r-.; : ~ .. Q
Sandy clay
~
Peat
~ _.• •
P,
.- .D " 0 ' 85
Loam
.- .- Plant and wood delritus
0
".
-""
~o
... . . ,
b:d
Sandy silt
-
Coal
....:!L.
..
10
-../
' -
Figure 3: Proposed interpretation of HRS data. I - Cenozoic sequences documented in well No. 15 (Strepetova et
aI., 1981; Gusev and Grinenko, 1985); II - Full Cenozoic section penetrated in well No. 0-6 (Sudakov et aI.,
1991); III - Generalized seismic stratigraphy integrated from HRS data and its correlation with geological record
in drill holes. For location of wells see Fig. 1. Note: Holocene sediments in columns 1-11 and all units in
column III are not to scale.
Interpretation of this feature in terms of the presence here of discontinuous frozen rocks implies
that their surface corresponds to Reflector 4, and that this surface has been disintegrated
because it does not cause distinct dynamic features which would be expected in case of
continuous solid permafrost. The results of cryogeothermal modeling performed for the
Pleistocene epoch for the whole LSS on the basis of paleogeographic data and theoretical
calculations (Soloviev, 1981; Soloviev et aI., 1987) are shown in Figure I and consistent with
the inferred presence of discontinuous permafrost at the location characterized by Figure 2c.
Alternatively, the lack of correlation observed in Figure 2c may be caused by gas emanations
of either biogenic or crustal nature. Such possibility is confirmed by numerous methane shows
established in bottom sediments throughout the LSS. Similar seismic records associated with
gas-saturated sediments were also observed in many proven oil and gas provinces.
The model developed by Soloviev for the LSS (Soloviev, 198 L Soloviev et al., 1987)
proposes the existence of the areas with different cryogeothermal history. The area subjected to
the longest freezing is recognized in a relatively narrow coastal zone adjacent to the mainland
and New Siberian Islands, as well as in small isolated localities east of the Lena River delta; this
area is believed to have remained in subaerial conditions since the earliest Pleistocene. The
second area with shorter freezing history (i.e. the land which did not emerge until the beginning
of Late Pleistocene) borders the first cryolithozone and also forms a longitudinal contour in