

592
Land-Ocean Systems in the Siberian Arctic: Dvnamics and History
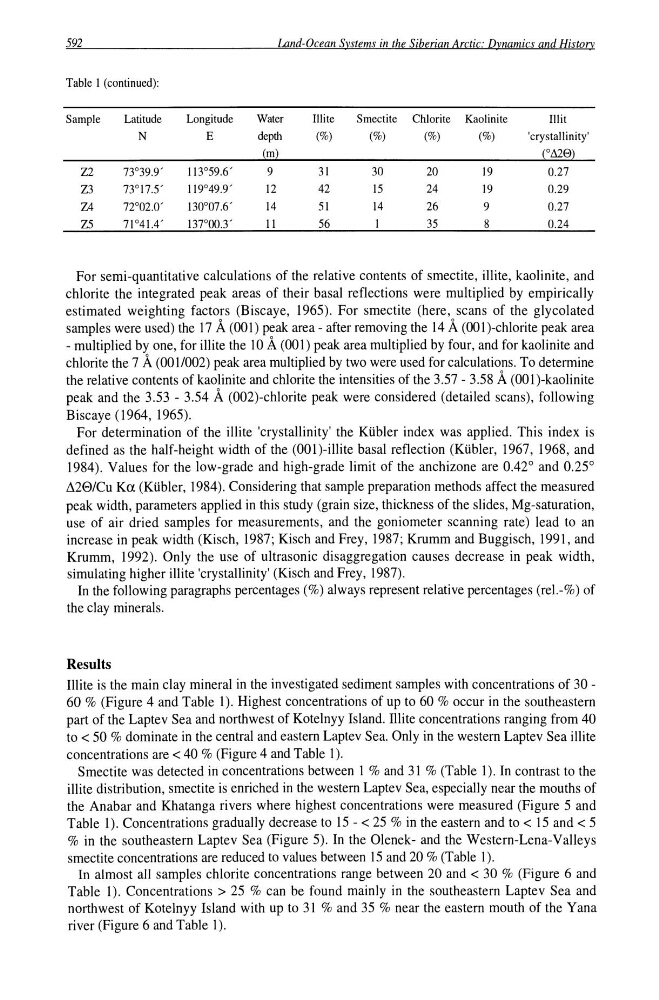
Table 1 (continued):
Sample
Latitude
Longitude
Water
Illite
Smectite Chlorite Kaolinite
Illit
N
E
depth
(%)
(%)
(%)
(%)
'crystallinity'
(m)
(0~8)
Z2
73°39.9'
113°59.6'
9
31
30
20
19
0.27
Z3
73°17.S'
119°49.9'
12
42
15
24
19
0.29
Z4
72°02.0'
130°07.6'
14
51
14
26
9
0.27
Z5
71 °41.4'
137°00T
II
56
35
8
0.24
For semi-quantitative calculations of the relative contents of smectite, illite, kaolinite, and
chlorite the integrated peak areas of their basal reflections were multiplied by empirically
estimated weighting factors (Biscaye, 1965). For smectite (here, scans of the glycolated
samples were used) the 17 A (001) peak area - after removing the 14 A (001 )-chlorite peak area
- multiplied by one, for illite the 10 A (001) peak area multiplied by four, and for kaolinite and
chlorite the 7 A (001/002) peak area multiplied by two were used for calculations. To determine
the relative contents of kaolinite and chlorite the intensities of the 3.57 - 3.58 A (001 )-kaolinite
peak and the 3.53 - 3.54 A (002)-chlorite peak were considered (detailed scans), following
Biscaye (1964, 1965).
For determination of the illite 'crystallinity' the Kiibler index was applied. This index is
defined as the half-height width of the (OO1)-illite basal reflection (Kiibler, 1967, 1968, and
1984). Values for the low-grade and high-grade limit of the anchizone are 0.42° and 0.25°
il28/Cu Ka (Kiibler, 1984). Considering that sample preparation methods affect the measured
peak width, parameters applied in this study (grain size, thickness of the slides, Mg-saturation,
use of air dried samples for measurements, and the goniometer scanning rate) lead to an
increase in peak width (Kisch, 1987; Kisch and Frey, 1987; Krumm and Buggisch, 1991, and
Krumm, 1992). Only the use of ultrasonic disaggregation causes decrease in peak width,
simulating higher illite 'crystallinity' (Kisch and Frey, 1987).
In the following paragraphs percentages (%) always represent relative percentages (rel.-%) of
the clay minerals.
Results
Illite is the main clay mineral in the investigated sediment samples with concentrations of 30 -
60 % (Figure 4 and Table 1). Highest concentrations of up to 60 % occur in the southeastern
part of the Laptev Sea and northwest of Kotelnyy Island. Illite concentrations ranging from 40
to < 50 % dominate in the central and eastern Laptev Sea. Only in the western Laptev Sea illite
concentrations are < 40 % (Figure 4 and Table 1).
Smectite was detected in concentrations between I % and 31 % (Table I). In contrast to the
illite distribution, smectite is enriched in the western Laptev Sea, especially near the mouths of
the Anabar and Khatanga rivers where highest concentrations were measured (Figure 5 and
Table I). Concentrations gradually decrease to 15 - < 25 % in the eastern and to < 15 and < 5
% in the southeastern Laptev Sea (Figure 5). In the Olenek- and the Western-Len a-Valleys
smectite concentrations are reduced to values between 15 and 20 % (Table I).
In almost all samples chlorite concentrations range between 20 and < 30 % (Figure 6 and
Table I). Concentrations> 25 % can be found mainly in the southeastern Laptev Sea and
northwest of Kotelnyy Island with up to 31 % and 35 % near the eastern mouth of the Yana
river (Figure 6 and Table I).
Land-Ocean Systems in the Siberian Arctic: Dvnamics and History
Table 1 (continued):
Sample
Latitude
Longitude
Water
Illite
Smectite Chlorite Kaolinite
Illit
N
E
depth
(%)
(%)
(%)
(%)
'crystallinity'
(m)
(0~8)
Z2
73°39.9'
113°59.6'
9
31
30
20
19
0.27
Z3
73°17.S'
119°49.9'
12
42
15
24
19
0.29
Z4
72°02.0'
130°07.6'
14
51
14
26
9
0.27
Z5
71 °41.4'
137°00T
II
56
35
8
0.24
For semi-quantitative calculations of the relative contents of smectite, illite, kaolinite, and
chlorite the integrated peak areas of their basal reflections were multiplied by empirically
estimated weighting factors (Biscaye, 1965). For smectite (here, scans of the glycolated
samples were used) the 17 A (001) peak area - after removing the 14 A (001 )-chlorite peak area
- multiplied by one, for illite the 10 A (001) peak area multiplied by four, and for kaolinite and
chlorite the 7 A (001/002) peak area multiplied by two were used for calculations. To determine
the relative contents of kaolinite and chlorite the intensities of the 3.57 - 3.58 A (001 )-kaolinite
peak and the 3.53 - 3.54 A (002)-chlorite peak were considered (detailed scans), following
Biscaye (1964, 1965).
For determination of the illite 'crystallinity' the Kiibler index was applied. This index is
defined as the half-height width of the (OO1)-illite basal reflection (Kiibler, 1967, 1968, and
1984). Values for the low-grade and high-grade limit of the anchizone are 0.42° and 0.25°
il28/Cu Ka (Kiibler, 1984). Considering that sample preparation methods affect the measured
peak width, parameters applied in this study (grain size, thickness of the slides, Mg-saturation,
use of air dried samples for measurements, and the goniometer scanning rate) lead to an
increase in peak width (Kisch, 1987; Kisch and Frey, 1987; Krumm and Buggisch, 1991, and
Krumm, 1992). Only the use of ultrasonic disaggregation causes decrease in peak width,
simulating higher illite 'crystallinity' (Kisch and Frey, 1987).
In the following paragraphs percentages (%) always represent relative percentages (rel.-%) of
the clay minerals.
Results
Illite is the main clay mineral in the investigated sediment samples with concentrations of 30 -
60 % (Figure 4 and Table 1). Highest concentrations of up to 60 % occur in the southeastern
part of the Laptev Sea and northwest of Kotelnyy Island. Illite concentrations ranging from 40
to < 50 % dominate in the central and eastern Laptev Sea. Only in the western Laptev Sea illite
concentrations are < 40 % (Figure 4 and Table 1).
Smectite was detected in concentrations between I % and 31 % (Table I). In contrast to the
illite distribution, smectite is enriched in the western Laptev Sea, especially near the mouths of
the Anabar and Khatanga rivers where highest concentrations were measured (Figure 5 and
Table I). Concentrations gradually decrease to 15 - < 25 % in the eastern and to < 15 and < 5
% in the southeastern Laptev Sea (Figure 5). In the Olenek- and the Western-Len a-Valleys
smectite concentrations are reduced to values between 15 and 20 % (Table I).
In almost all samples chlorite concentrations range between 20 and < 30 % (Figure 6 and
Table I). Concentrations> 25 % can be found mainly in the southeastern Laptev Sea and
northwest of Kotelnyy Island with up to 31 % and 35 % near the eastern mouth of the Yana
river (Figure 6 and Table I).