

526
Land-Ocean Systems in the Siberian Arctic: Dvnamics and History
Table 7: Atmospheric lOBe fluxes as determined at other locations.
Atmospheric lOBe fluxes
References
Investigated material
1.21 ± 0,26 IlO6 at cm-2 a-I
Monaghan, 1985/86
North America, Precipitation
1.50 ± 0.50 D06 at cm- 2 a-I
Lao et aI., 1992 alb
Pacific, Sediments
- 0.7 D06 at cm-2 a-I
Southon et aI., 1987
North Atlantic, Sediments
- 0.3 D06 at cm-2 a-I
Finkel et aI., 1977
Arctic, Sediments
Station 15
Station 14
0
0
:g
500
500
!
1000
1000
~
1500
1500
2000
2000
2500
2500
0
500
1000
1500
0
500
1000
1500
lOse [at/g]
lOse [at/g]
Station 8
Station 2
0
0
f
:g
500
500
!
1000
1000
b
1500
1500
~ 2000
2000
2500
2500
0
500
1000
1500
0
500
1000
1500
lOse [at/g]
lOse [at/g]
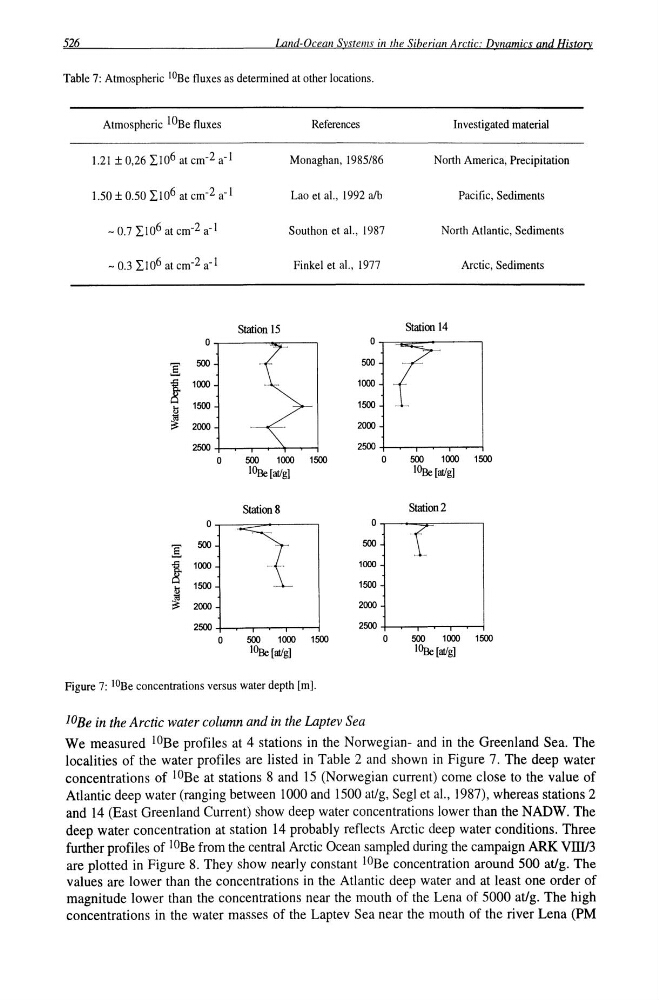
Figure 7: lOBe concentrations versus water depth [mI.
lOBe in the Arctic water column and in the Laptev Sea
We measured lOBe profiles at 4 stations in the Norwegian- and in the Greenland Sea. The
localities of the water profiles are listed in Tab]e 2 and shown in Figure 7. The deep water
concentrations of lOBe at stations 8 and 15 (Norwegian current) come close to the value of
Atlantic deep water (ranging between 1000 and 1500 at/g, Segl et aI., 1987), whereas stations 2
and 14 (East Greenland Current) show deep water concentrations lower than the NADW. The
deep water concentration at station 14 probably reflects Arctic deep water conditions. Three
further profiles of lOBe from the central Arctic Ocean sampled during the campaign ARK VIII/3
are plotted in Figure 8. They show nearly constant lOBe concentration around 500 at/g. The
values are lower than the concentrations in the Atlantic deep water and at least one order of
magnitude lower than the concentrations near the mouth of the Lena of 5000 at/g. The high
concentrations in the water masses of the Laptev Sea near the mouth of the river Lena (PM
Land-Ocean Systems in the Siberian Arctic: Dvnamics and History
Table 7: Atmospheric lOBe fluxes as determined at other locations.
Atmospheric lOBe fluxes
References
Investigated material
1.21 ± 0,26 IlO6 at cm-2 a-I
Monaghan, 1985/86
North America, Precipitation
1.50 ± 0.50 D06 at cm- 2 a-I
Lao et aI., 1992 alb
Pacific, Sediments
- 0.7 D06 at cm-2 a-I
Southon et aI., 1987
North Atlantic, Sediments
- 0.3 D06 at cm-2 a-I
Finkel et aI., 1977
Arctic, Sediments
Station 15
Station 14
0
0
:g
500
500
!
1000
1000
~
1500
1500
2000
2000
2500
2500
0
500
1000
1500
0
500
1000
1500
lOse [at/g]
lOse [at/g]
Station 8
Station 2
0
0
f
:g
500
500
!
1000
1000
b
1500
1500
~ 2000
2000
2500
2500
0
500
1000
1500
0
500
1000
1500
lOse [at/g]
lOse [at/g]
Figure 7: lOBe concentrations versus water depth [mI.
lOBe in the Arctic water column and in the Laptev Sea
We measured lOBe profiles at 4 stations in the Norwegian- and in the Greenland Sea. The
localities of the water profiles are listed in Tab]e 2 and shown in Figure 7. The deep water
concentrations of lOBe at stations 8 and 15 (Norwegian current) come close to the value of
Atlantic deep water (ranging between 1000 and 1500 at/g, Segl et aI., 1987), whereas stations 2
and 14 (East Greenland Current) show deep water concentrations lower than the NADW. The
deep water concentration at station 14 probably reflects Arctic deep water conditions. Three
further profiles of lOBe from the central Arctic Ocean sampled during the campaign ARK VIII/3
are plotted in Figure 8. They show nearly constant lOBe concentration around 500 at/g. The
values are lower than the concentrations in the Atlantic deep water and at least one order of
magnitude lower than the concentrations near the mouth of the Lena of 5000 at/g. The high
concentrations in the water masses of the Laptev Sea near the mouth of the river Lena (PM