

340
Land-Ocean Systems in the Siberian Arctic: Dynamics and History
E
~
o
10~
.c 20- Q.
Q)
""0
30
40
11'
I
'I'
I
I
~!
I
:I:
I
l- --I
*
__________ . permafrost-boundary ___________
o
100
200
300
400
500
600
methane oxidation rate [119 CH 4 *dm- 3 *d- 1 ]
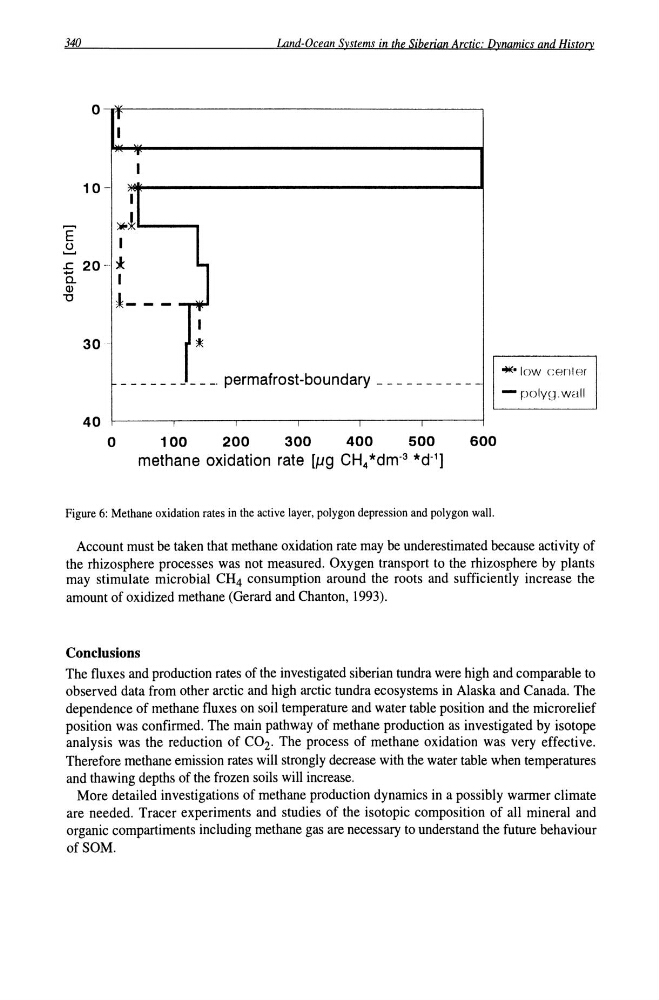
Figure 6: Methane oxidation rates in the active layer, polygon depression and polygon wall.
"·Iow cEmlef
- polyu· wall
Account must be taken that methane oxidation rate may be underestimated because activity of
the rhizosphere processes was not measured. Oxygen transport to the rhizosphere by plants
may stimulate microbial CH 4 consumption around the roots and sufficiently increase the
amount of oxidized methane (Gerard and Chanton, 1993).
Conclusions
The fluxes and production rates of the investigated siberian tundra were high and comparable to
observed data from other arctic and high arctic tundra ecosystems in Alaska and Canada. The
dependence of methane fluxes on soil temperature and water table position and the microrelief
position was confirmed. The main pathway of methane production as investigated by isotope
analysis was the reduction of CO 2 , The process of methane oxidation was very effective.
Therefore methane emission rates will strongly decrease with the water table when temperatures
and thawing depths of the frozen soils will increase.
More detailed investigations of methane production dynamics in a possibly warmer climate
are needed. Tracer experiments and studies of the isotopic composition of all mineral and
organic compartiments including methane gas are necessary to understand the future behaviour
ofSOM.
Land-Ocean Systems in the Siberian Arctic: Dynamics and History
E
~
o
10~
.c 20- Q.
Q)
""0
30
40
11'
I
'I'
I
I
~!
I
:I:
I
l- --I
*
__________ . permafrost-boundary ___________
o
100
200
300
400
500
600
methane oxidation rate [119 CH 4 *dm- 3 *d- 1 ]
Figure 6: Methane oxidation rates in the active layer, polygon depression and polygon wall.
"·Iow cEmlef
- polyu· wall
Account must be taken that methane oxidation rate may be underestimated because activity of
the rhizosphere processes was not measured. Oxygen transport to the rhizosphere by plants
may stimulate microbial CH 4 consumption around the roots and sufficiently increase the
amount of oxidized methane (Gerard and Chanton, 1993).
Conclusions
The fluxes and production rates of the investigated siberian tundra were high and comparable to
observed data from other arctic and high arctic tundra ecosystems in Alaska and Canada. The
dependence of methane fluxes on soil temperature and water table position and the microrelief
position was confirmed. The main pathway of methane production as investigated by isotope
analysis was the reduction of CO 2 , The process of methane oxidation was very effective.
Therefore methane emission rates will strongly decrease with the water table when temperatures
and thawing depths of the frozen soils will increase.
More detailed investigations of methane production dynamics in a possibly warmer climate
are needed. Tracer experiments and studies of the isotopic composition of all mineral and
organic compartiments including methane gas are necessary to understand the future behaviour
ofSOM.